Metrology Laboratory
→ For all requests for initial tests, please fill this form: MLab initial tests request
→ Availability of spare instruments
→ Contact the Metrology Laboratory at help-atc@lsce.ipsl.fr


The main tasks of the ATC Metrology Laboratory are:
- Testing all the greenhouse gases (GHG) instruments before deployment within the ICOS Atmospheric network, producing a test report and a certificate of compliance.
- Development of meaningful tests (e.g water vapor correction).
- Carrying out a technology watch.
- Elaborating the measurement/calibration protocols.
- Studying the possible artifacts (sampling system, analyzer...).
- Providing network support and spare instruments when necessary.
- Development of new sensors through R&D programs at national and international level.
- Participating at the European training centre for ICOS atmospheric measurements with the Data Unit.
For all requests for initial tests, please fill this form: MLab initial tests request.
Hereafter, we present the main tests conducted on all the GHG instruments for ICOS, extracted of Yver Kwok, C., Laurent, O., Guemri, A., Philippon, C., Wastine, B., Rella, C. W., Vuillemin, C., Truong, F., Delmotte, M., Kazan, V., Darding, M., Lebègue, B., Kaiser, C., Xueref-Rémy, I., and Ramonet, M.: Comprehensive laboratory and field testing of cavity ring-down spectroscopy analyzers measuring H2O, CO2, CH4 and CO, Atmos. Meas. Tech., 8, 3867–3892, https://doi.org/10.5194/amt-8-3867-2015, 2015.
Testing descriptions:
-
Continuous Measurement Repeatability and Short-term drift: The continuous measurement repeatability (CMR) is evaluated with the SD of the continuous measurements of a cylinder over 24 h. The short-term drift is defined as the peak-to-peak amplitude of the same measurements. These two metrics are evaluated for different integration times (typically, raw data, 1 min and 1 h). Usually, in the synthesis report, we provide values for 1 min and 1 h averages.
Allan deviation: The Allan deviation, which shows the stability as a function of the integration time and informs about the optimal integration time, is also calculated and provided in the synthesis report.

Figure 1. CH4 continuous measurement repeatability. First panel: measurements averaged over different time intervals. Second panel: Allan deviation. -
Short-term repeatability: The short-term repeatability (STR) is defined as the repeated measure of a sample over a short period of time (about 3 h). In the laboratory, a target gas is measured 10 times in 15 min sequences bracketed by 5 min of wet ambient air measurements. For each measure, only the last 9 min are averaged. The repeatability is then expressed through the mean and SD of these averaged measures.
Long-term repeatability: The long-term repeatability (LTR) is comparable to the short-term repeatability but on a longer timescale (3 days). In the laboratory, a target gas is measured for 30 min bracketed by around 5 h of wet ambient air over 72 h of total measurements. For each measure, only the last 10 min are averaged. The long-term repeatability is then expressed through the SD of these averaged measures. Typically, several 3-day exercises are performed and the results compared and aggregated at the end of the 1-month duration of the instrument test period. In Fig. 2 shows an example of short-term and long-term repeatability. For each species the mean, the SD and the drift are calculated.
Figure 2. Short-term and long-term repeatability for the three species. First panel: short-term repeatability. Second panel: long-term repeatability. -
Ambient temperature and pressure dependence: For the pressure, we plot the target gas measurements realized during the long-term repeatability test against the atmospheric pressure over several days and evaluate the correlation between the two. For the temperature dependence, the room temperature was until now varied using the room air conditioning system and we plot the target gas measurements against this varying temperature. Plans have been made to acquire a temperature-controlled chamber. As for the pressure, the correlation between the two is calculated. Two examples are shown in Fig. 3 with for each case, the linear regression and the correlation coefficients calculated.

Figure 3. CO pressure and temperature dependency. First panel: pressure dependency. Second panel: temperature dependency. On the right of the lower plot, the slope (I1), intercept (I0) and the coefficient of correlation (R2) are indicated. -
Water vapor correction: An important test for the CRDS instruments is the water vapor correction evaluation. The applied factory correction is the same for all instruments even if not all of them have the same response to water vapor. It is also not always possible to measure only dry air when in the field. Over the years, different tests have been applied to evaluate this correction, from comparing two instruments measuring the same air, one with a drying system, the second without, to the latest tests that progressively increase the humidity of the measured gas stream. The complete methodology and the results of these tests will be treated in a future publication.
-
Calibration: For an operational network, it is crucial to report not only precise but also accurate data linked to each other by a common scale. If each instrument is usually calibrated at the factory, the calibration scale used is not linked to the international WMO standards. Moreover, a regular calibration allows us to correct for long-term drift in the instrument. In the laboratory, at least four calibration sequences are done to determine the calibration function that links the measuredvalues to the assigned values. Three to four standard gases are measured one after the other at least four times for 30 min each calibration sequence (each set of the four cylinders measurement is hereafter called a cycle; see Fig. 4). Then the calibration function using a linear fit is calculated. The calibration standards are themselves calibrated against the international primary scale of each species (WMO X2019 for CO2, NOAA04 for CH4 and WMO CO X2004 for CO, Zhao and Tans, 2006; Dlugokencky et al., 2005; Novelli et al., 1994). Since 2008, six different secondary scales have been used. These calibrations are used for the comparison tests at the MLab.

Figure 4. Schematics of the calibration procedure at the MLab. With a measurement interval time of 20–30 min, a full sequence lasts between 5 and 8 h. -
Linearity: The linearity of the instrument is also evaluated. For the first instruments, the same cylinders as for calibration (four cylinders) were used. Then, two cylinders (low and high concentrated cylinders; see Fig. 5) were added to the set. The residuals from the fit are calculated, and their concentrations along with the correlation coefficient allow us to judge of the linearity of the instrument against the calibration scale. It is important to note that the validity of this test depends strongly on the proper assignation of the concentrations from each calibration cylinders, hence the importance of the linto internationals scales and the regular recalibrations of the MLab calibration cylinders against a “master” set of cylinders provided by the central calibration laboratories.

Figure 5. Linearity test for CO2. On the top panel, the measured values vs. the assigned values. On the right of this panel, the slope (I1), intercept (I0) and the coefficient of correlation (R2) are indicated. On the lower panel, the residuals, i.e., the difference between the assigned values and the values calculated using the linear equation, are shown. -
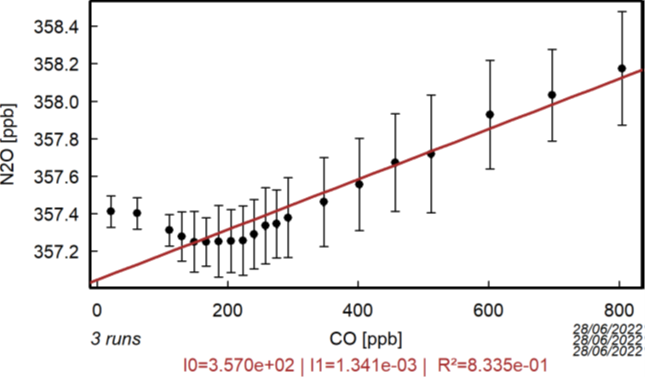
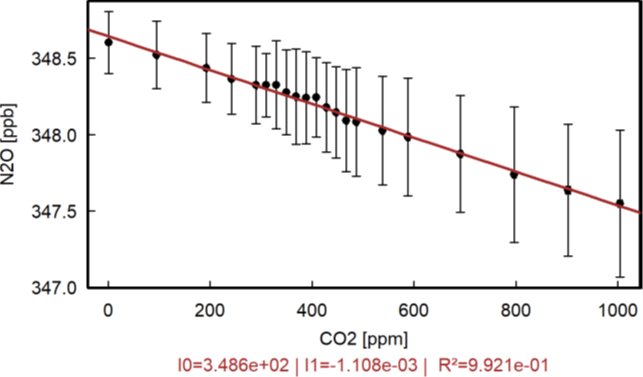
Cross sensitivity: For N2O/CO analyzers, we evaluate the correlation between N2O and CO measurements by measuring a tank filled with a high CO concentration and diluted by step with the same gas passing through a sofnocat trap. Same test is carried out with a tank filled with a high CO2 concentration and diluted thanks to an ascarite/magnesium perchlorate trap to evaluate the correlation with CO2 for N2O and CO measurements.


Figure 3. CO pressure and temperature dependency. First panel: pressure dependency. Second panel: temperature dependency. On the right of the lower plot, the slope (I1), intercept (I0) and the coefficient of correlation (R2) are indicated. -
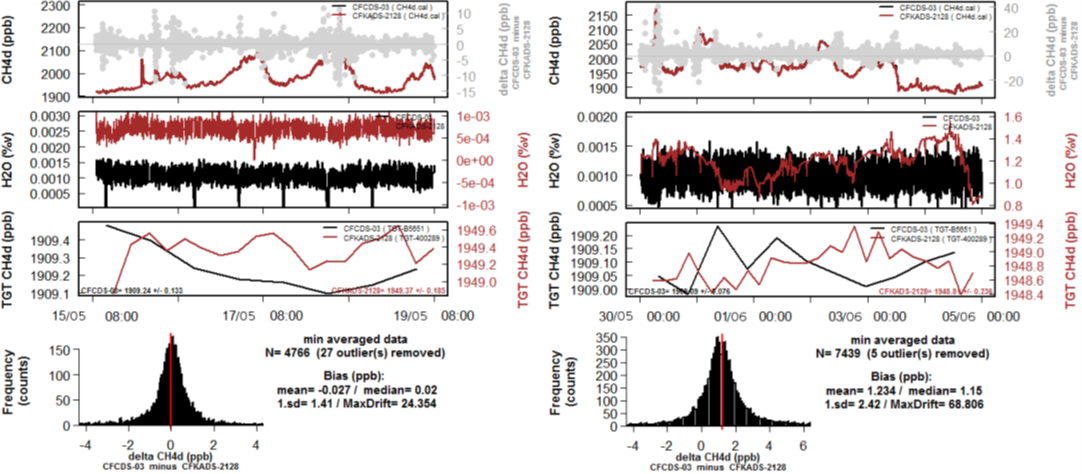
Comparison with reference instruments: Finally, ambient air measurements from each instrument are compared with other reference instruments maintained by the MLab. The MLab is located in Gif-sur-Yvette, about 50 km southwest of Paris. We are thus sampling suburban air with large variability as we are looking at 1 min averages. Initially, the CRDS analyzers were compared to the gas chromatograph system and if available to another CRDS analyzer in test. Since the end of 2011, most of the instruments have been tested against the same CRDS reference instrument for CO2 and CH4 (CFCDS03). For CO, since the end of 2013, a CRDS reference instrument (G2401) has also been chosen. And since mid 2017, a CRDS reference instrument for N2O/CO (G5310) is also available. The tested instrument measures wet and dry air and is compared to the MLab reference instrument which measures ambient air dried through a cryogenic water trap. This allows the checking of the factory and MLab water vapor correction and the estimation of the biases. In Fig. 6, the comparison for CH4 is shown. The H2O and target gas measurements allow a quality check of the tests. The histogram can point out outliers if the distribution is strongly not Gaussian. The difference between the wet corrected air and the dry air in the left panel (about 1.2 ppb on average compared to -0.03 ppb for both instruments measuring dryair) is due to the automatic H2O correction, which is here not sufficient to correct all the bias introduced by H2O.

Figure 6. Comparison with the reference instrument for CH4. First panel: dry air vs. dry air. Second panel: wet air corrected for H2O vs. dry air. From top to bottom, the concentrations for both instruments and the difference of the two are plotted, then the water vapor concentrations for both instruments, then the evolution of the target for both instruments and finally a histogram of the distribution of the differences along with statistics.
