
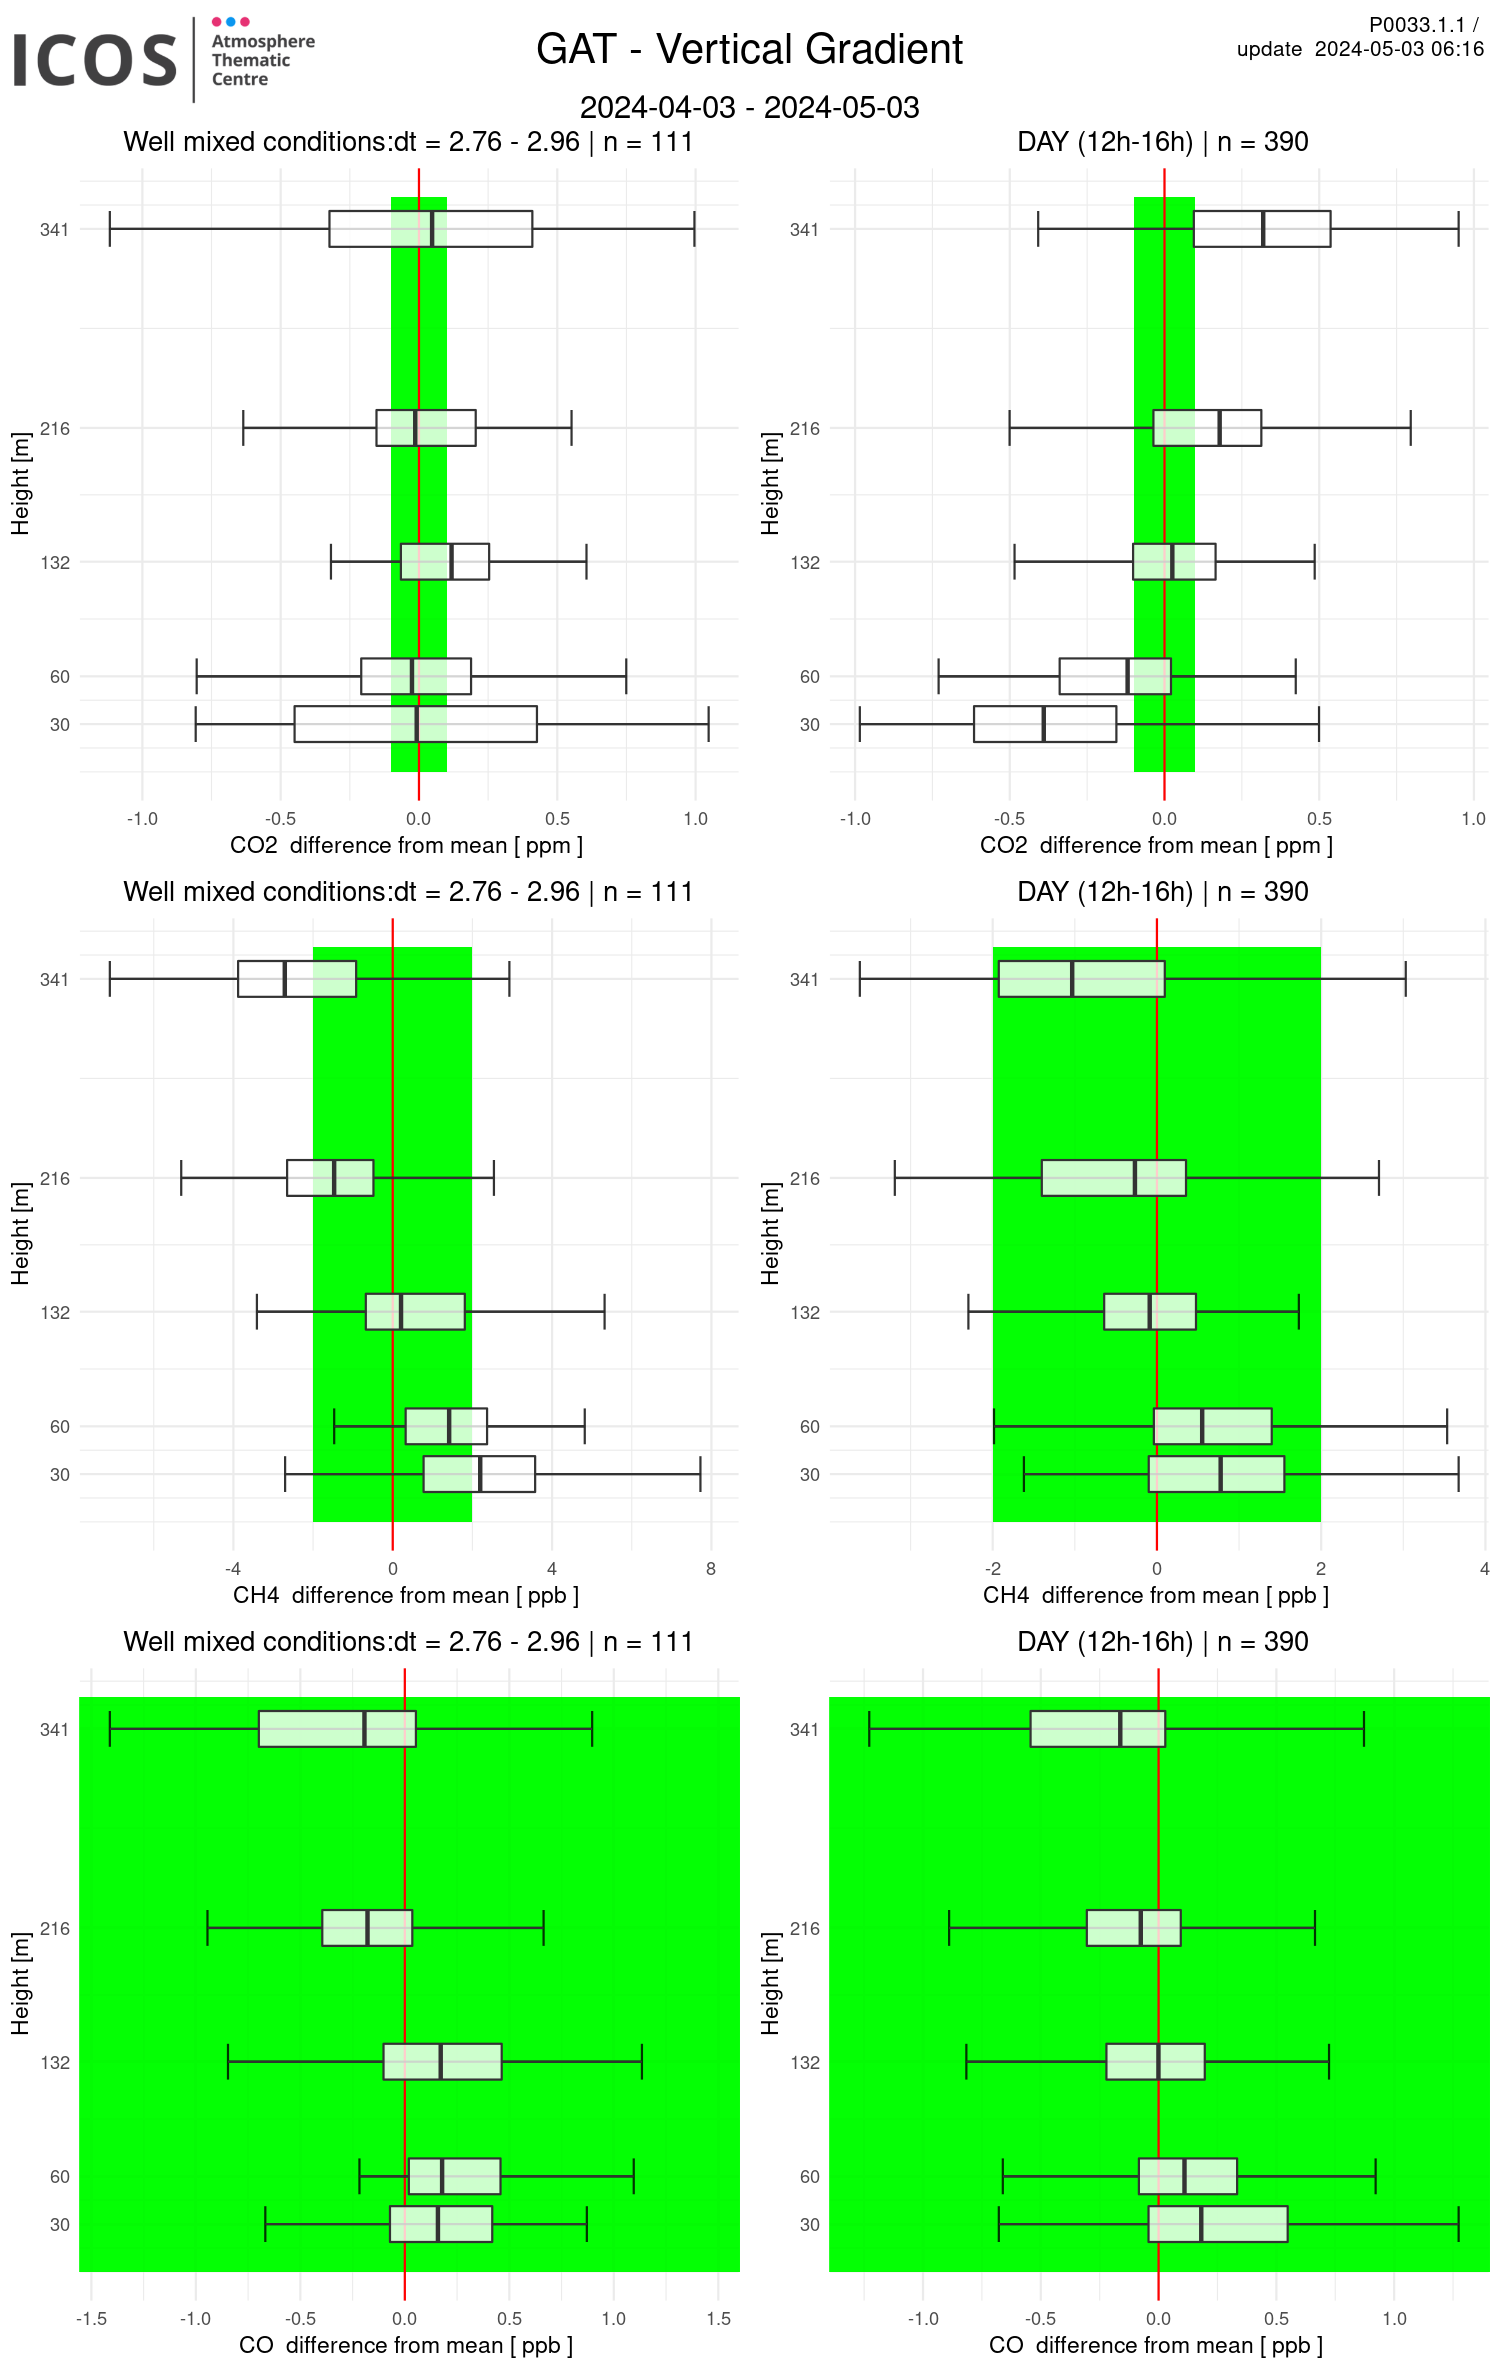
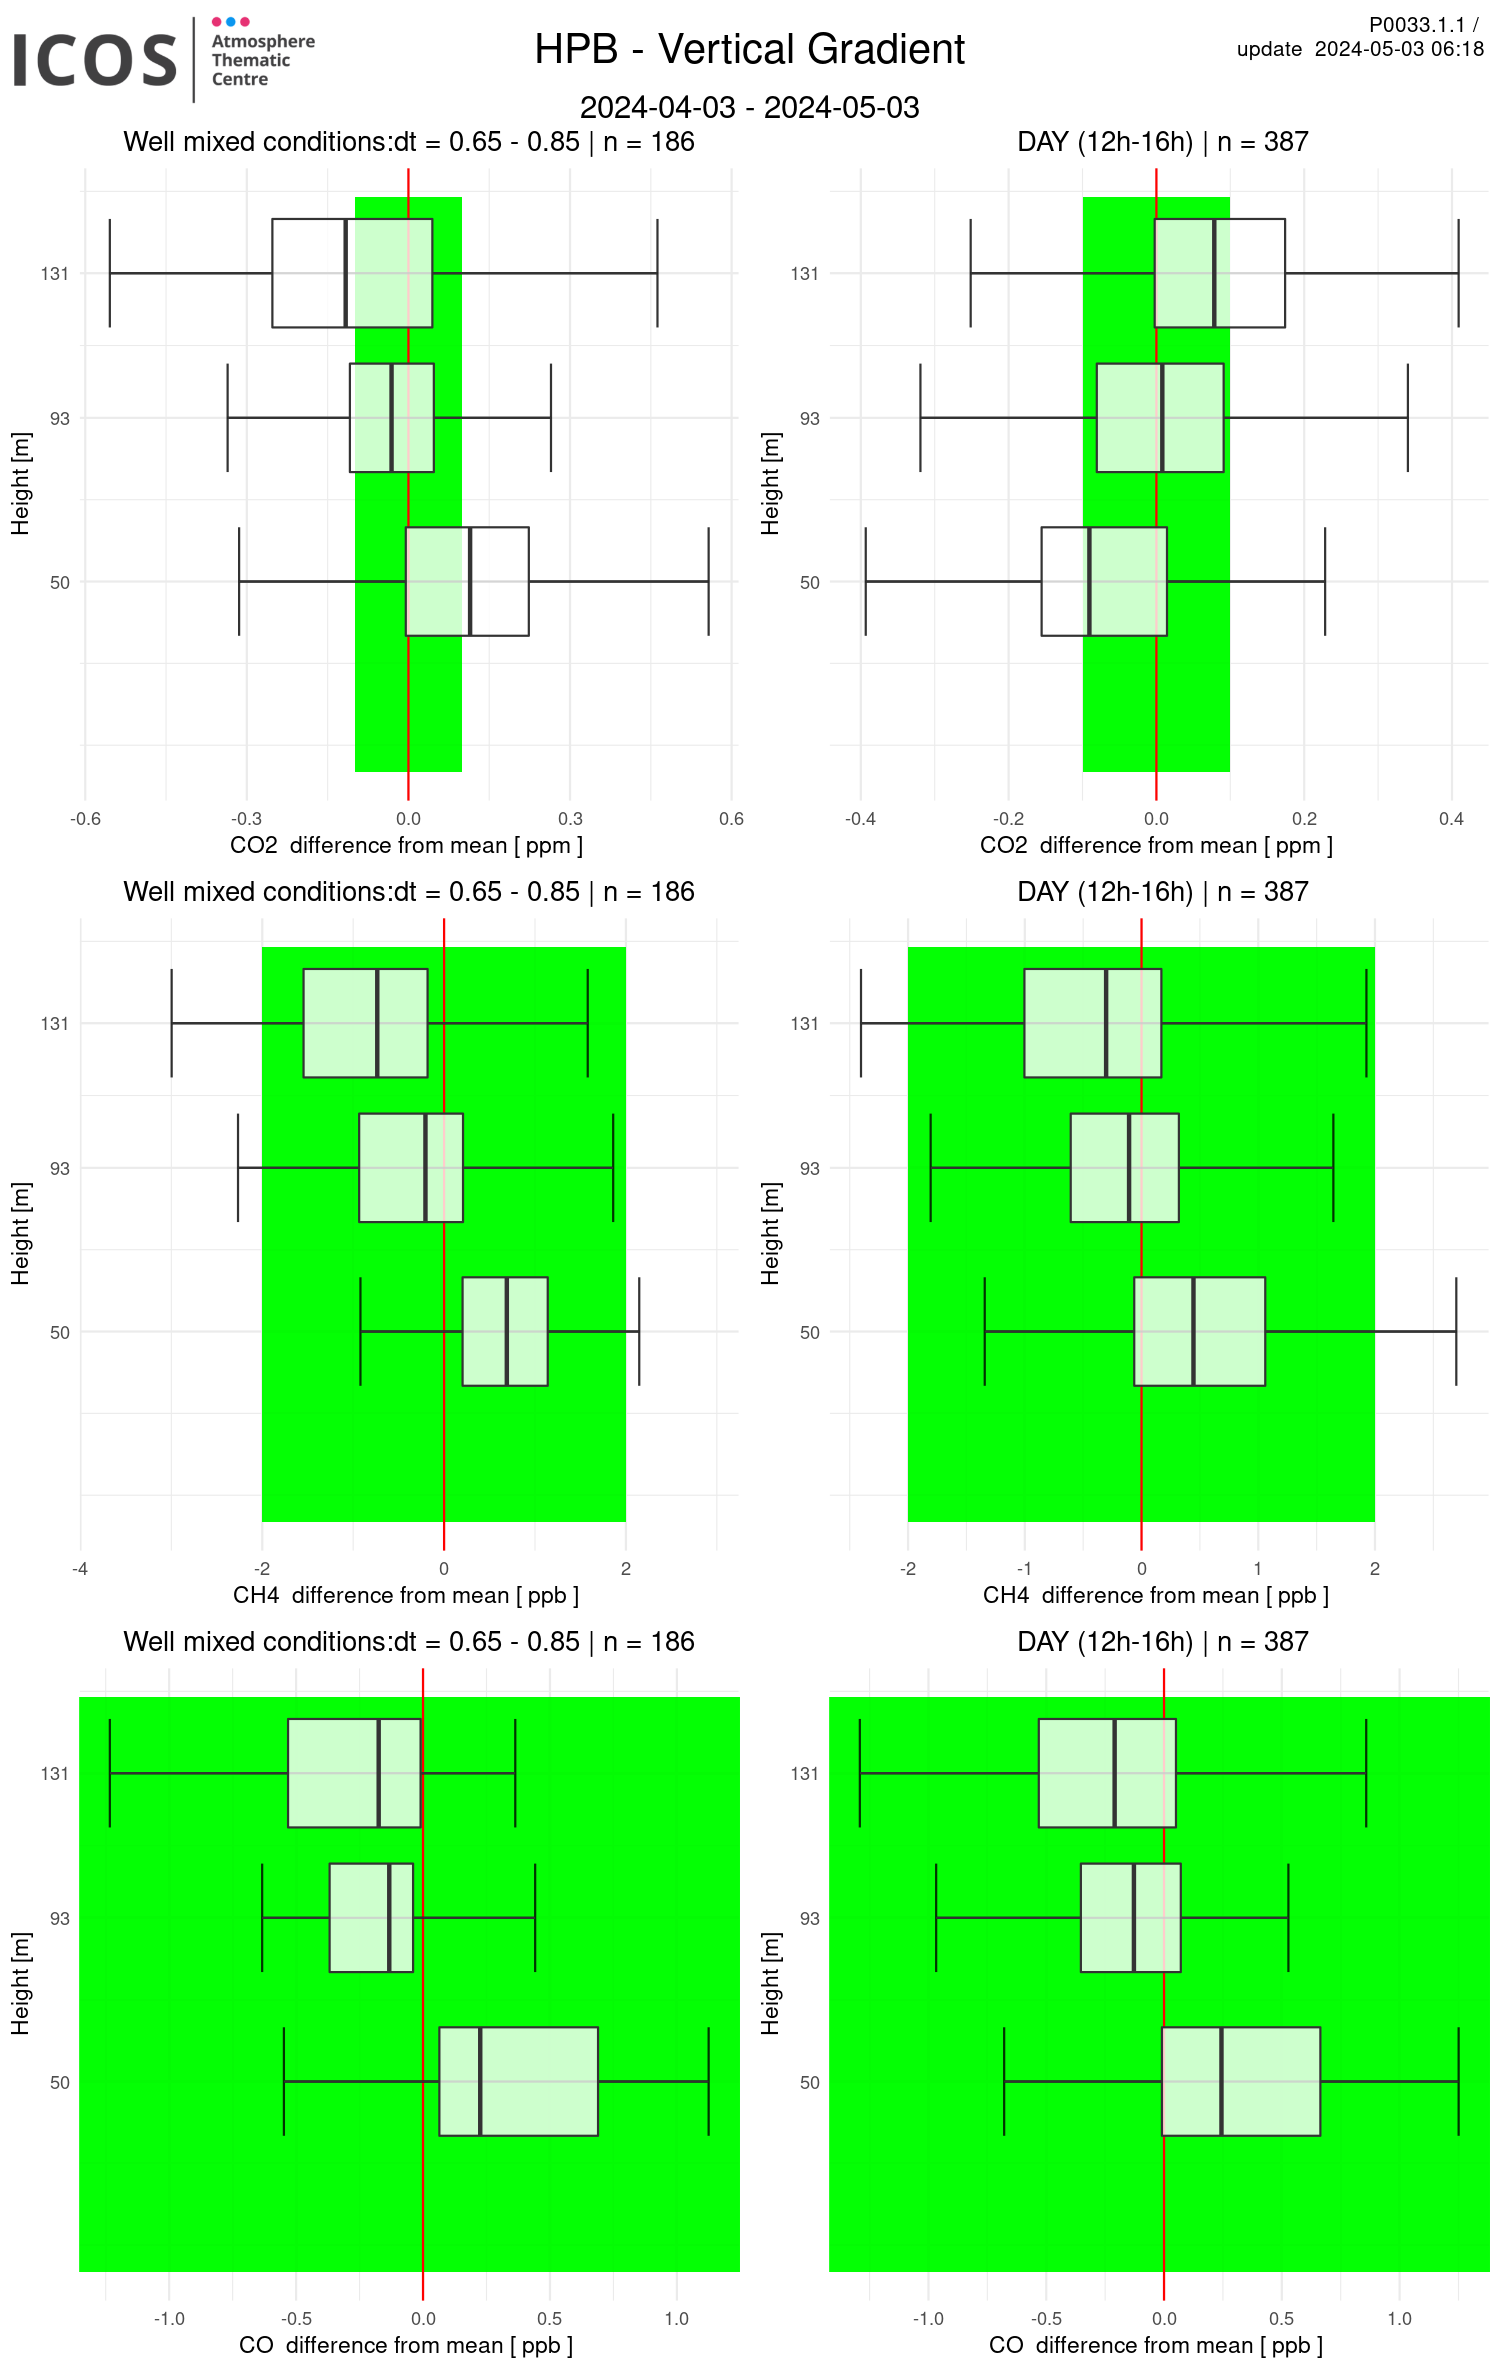
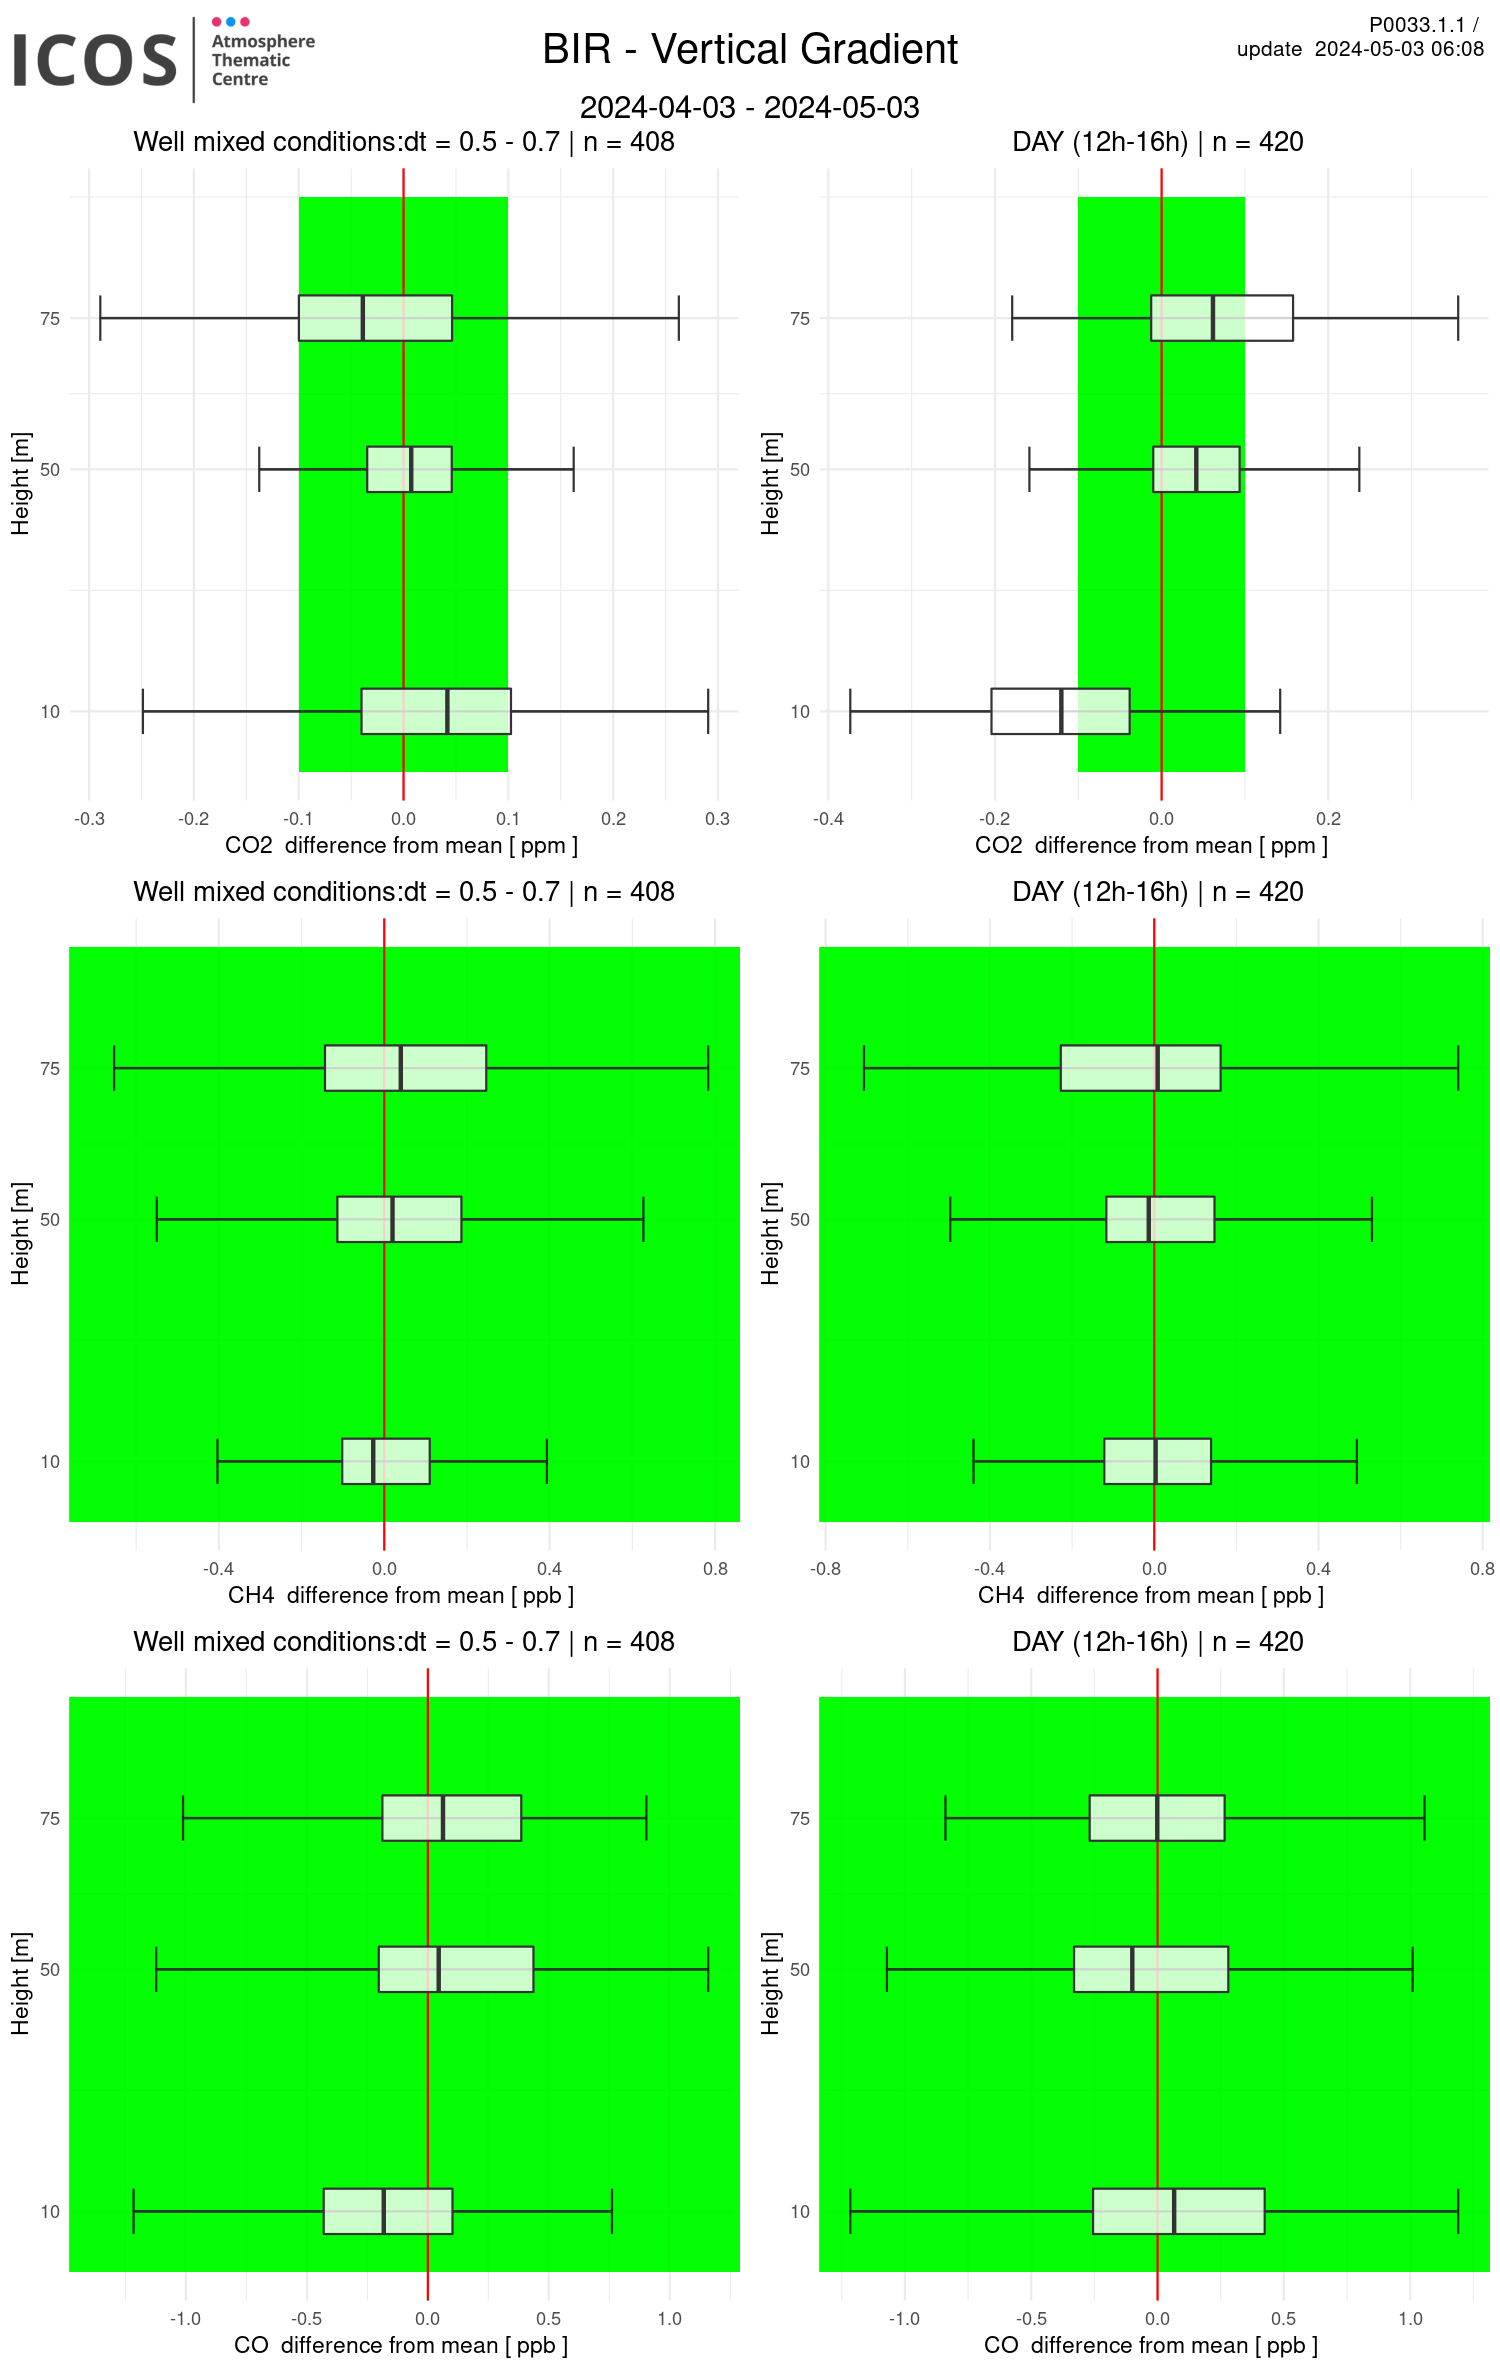
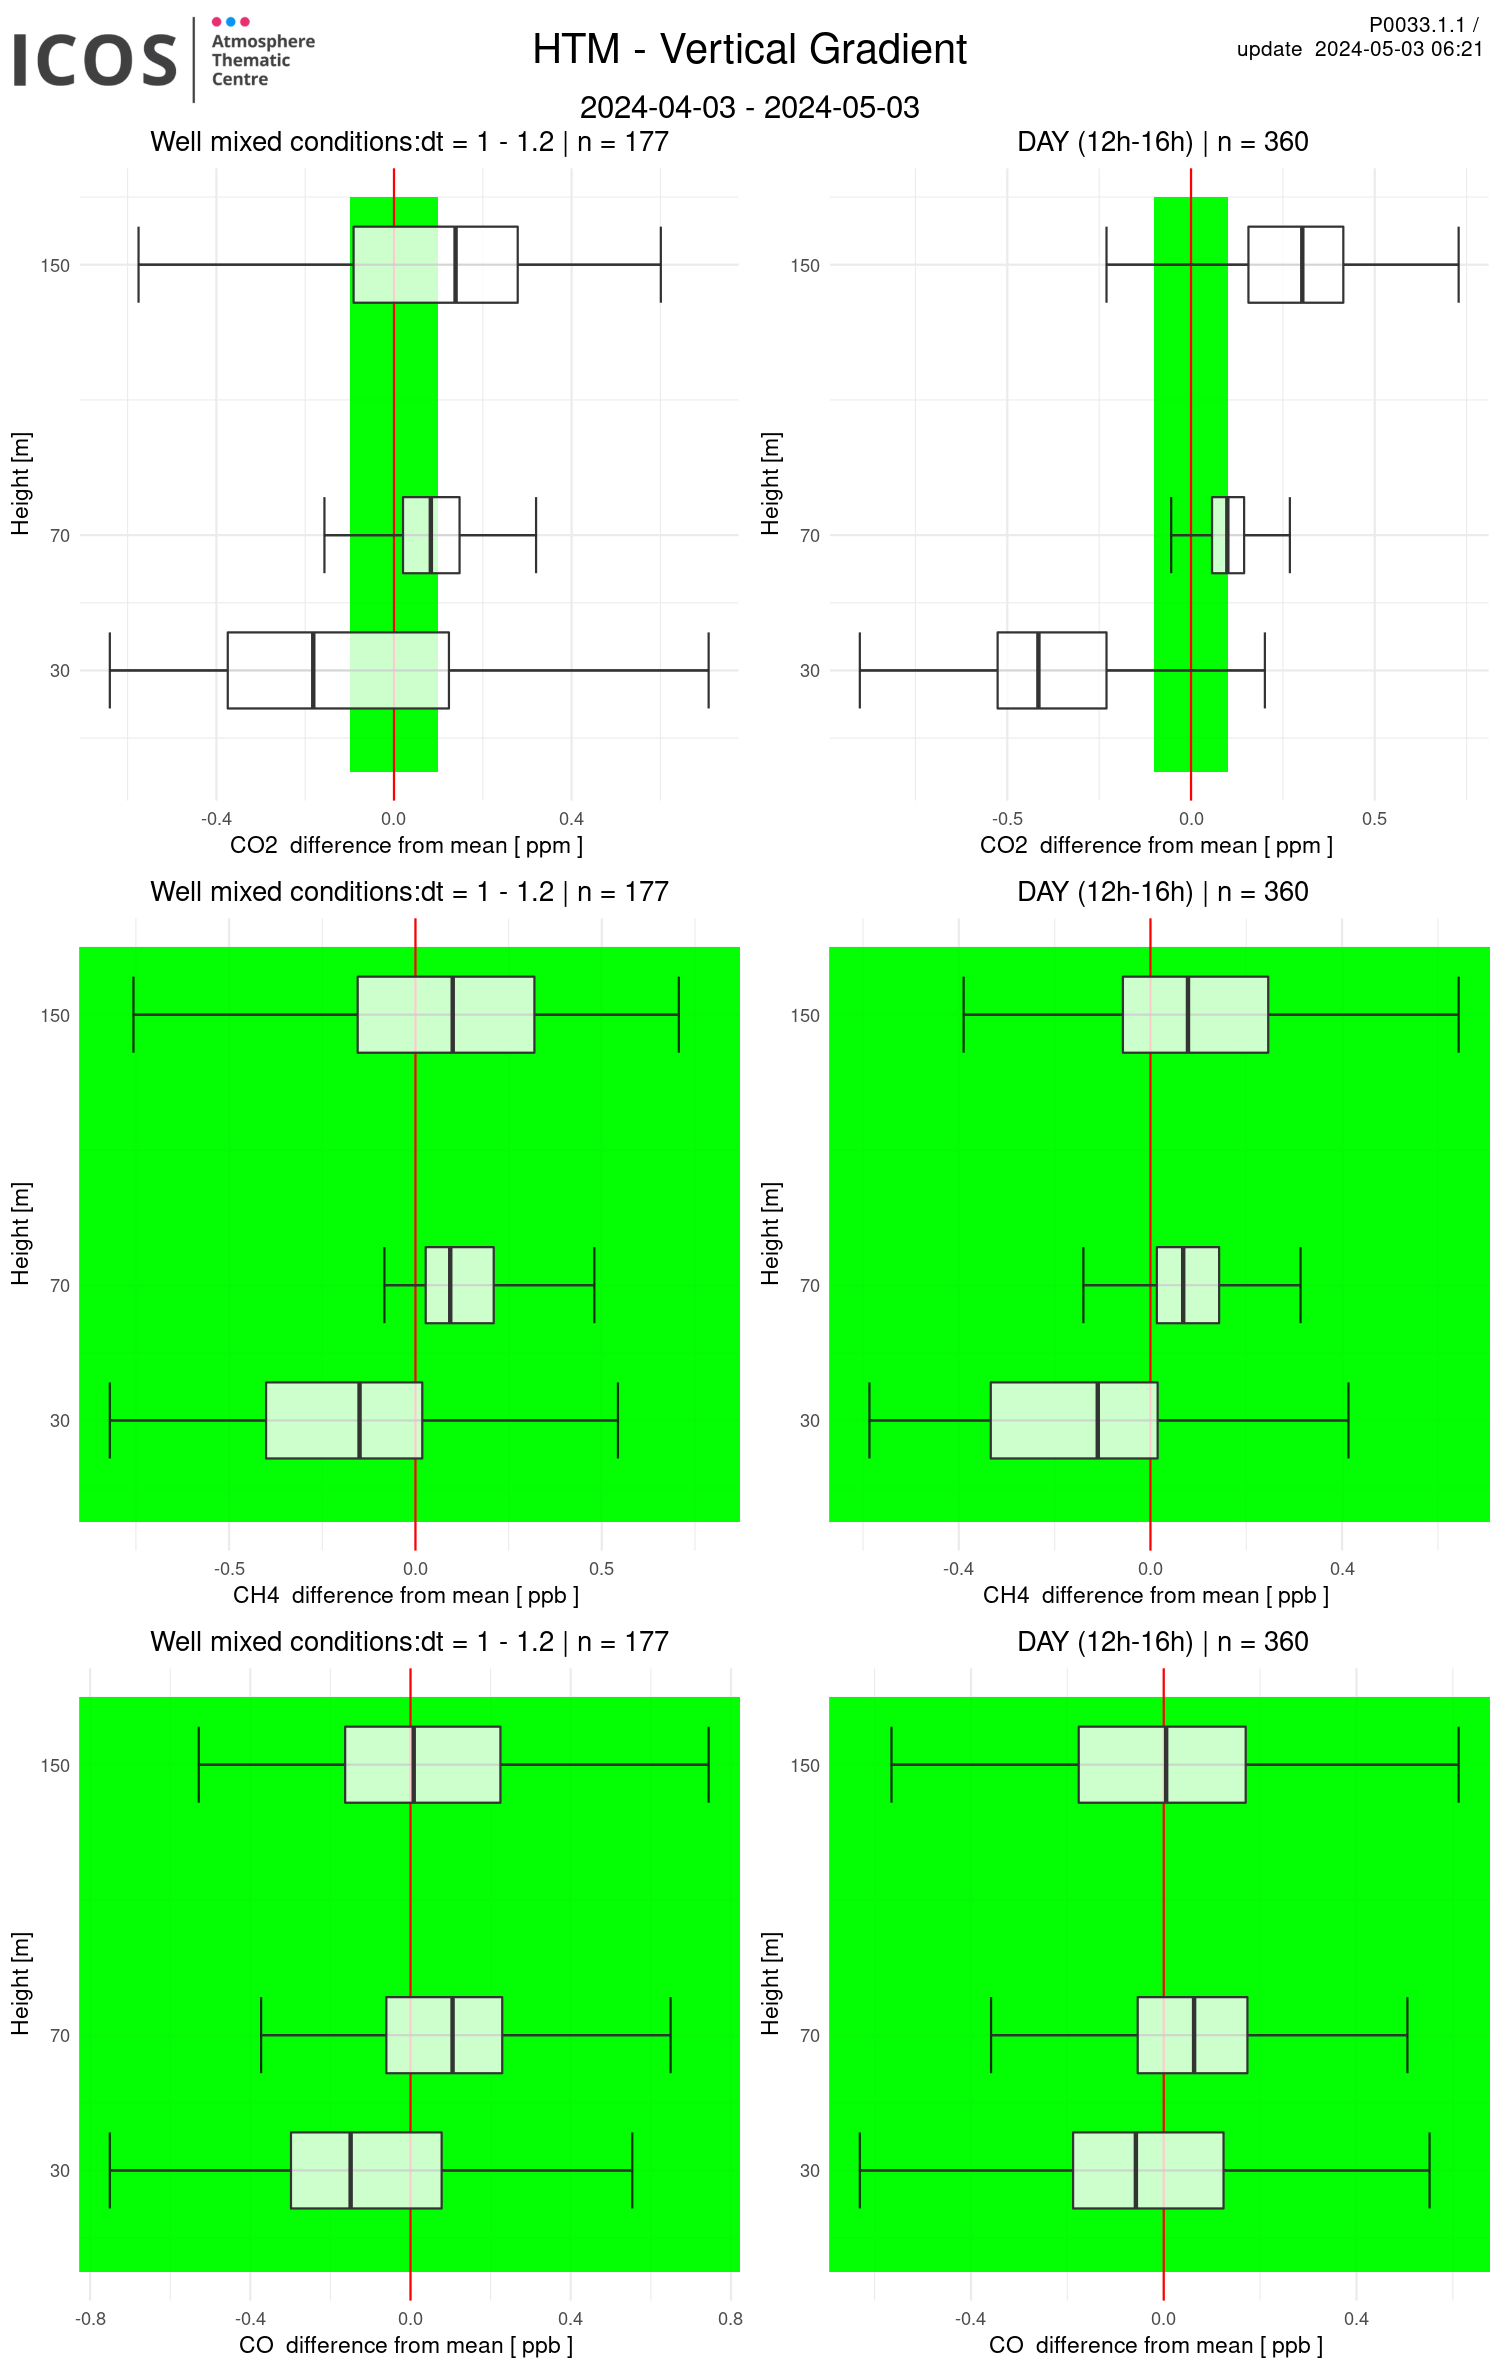
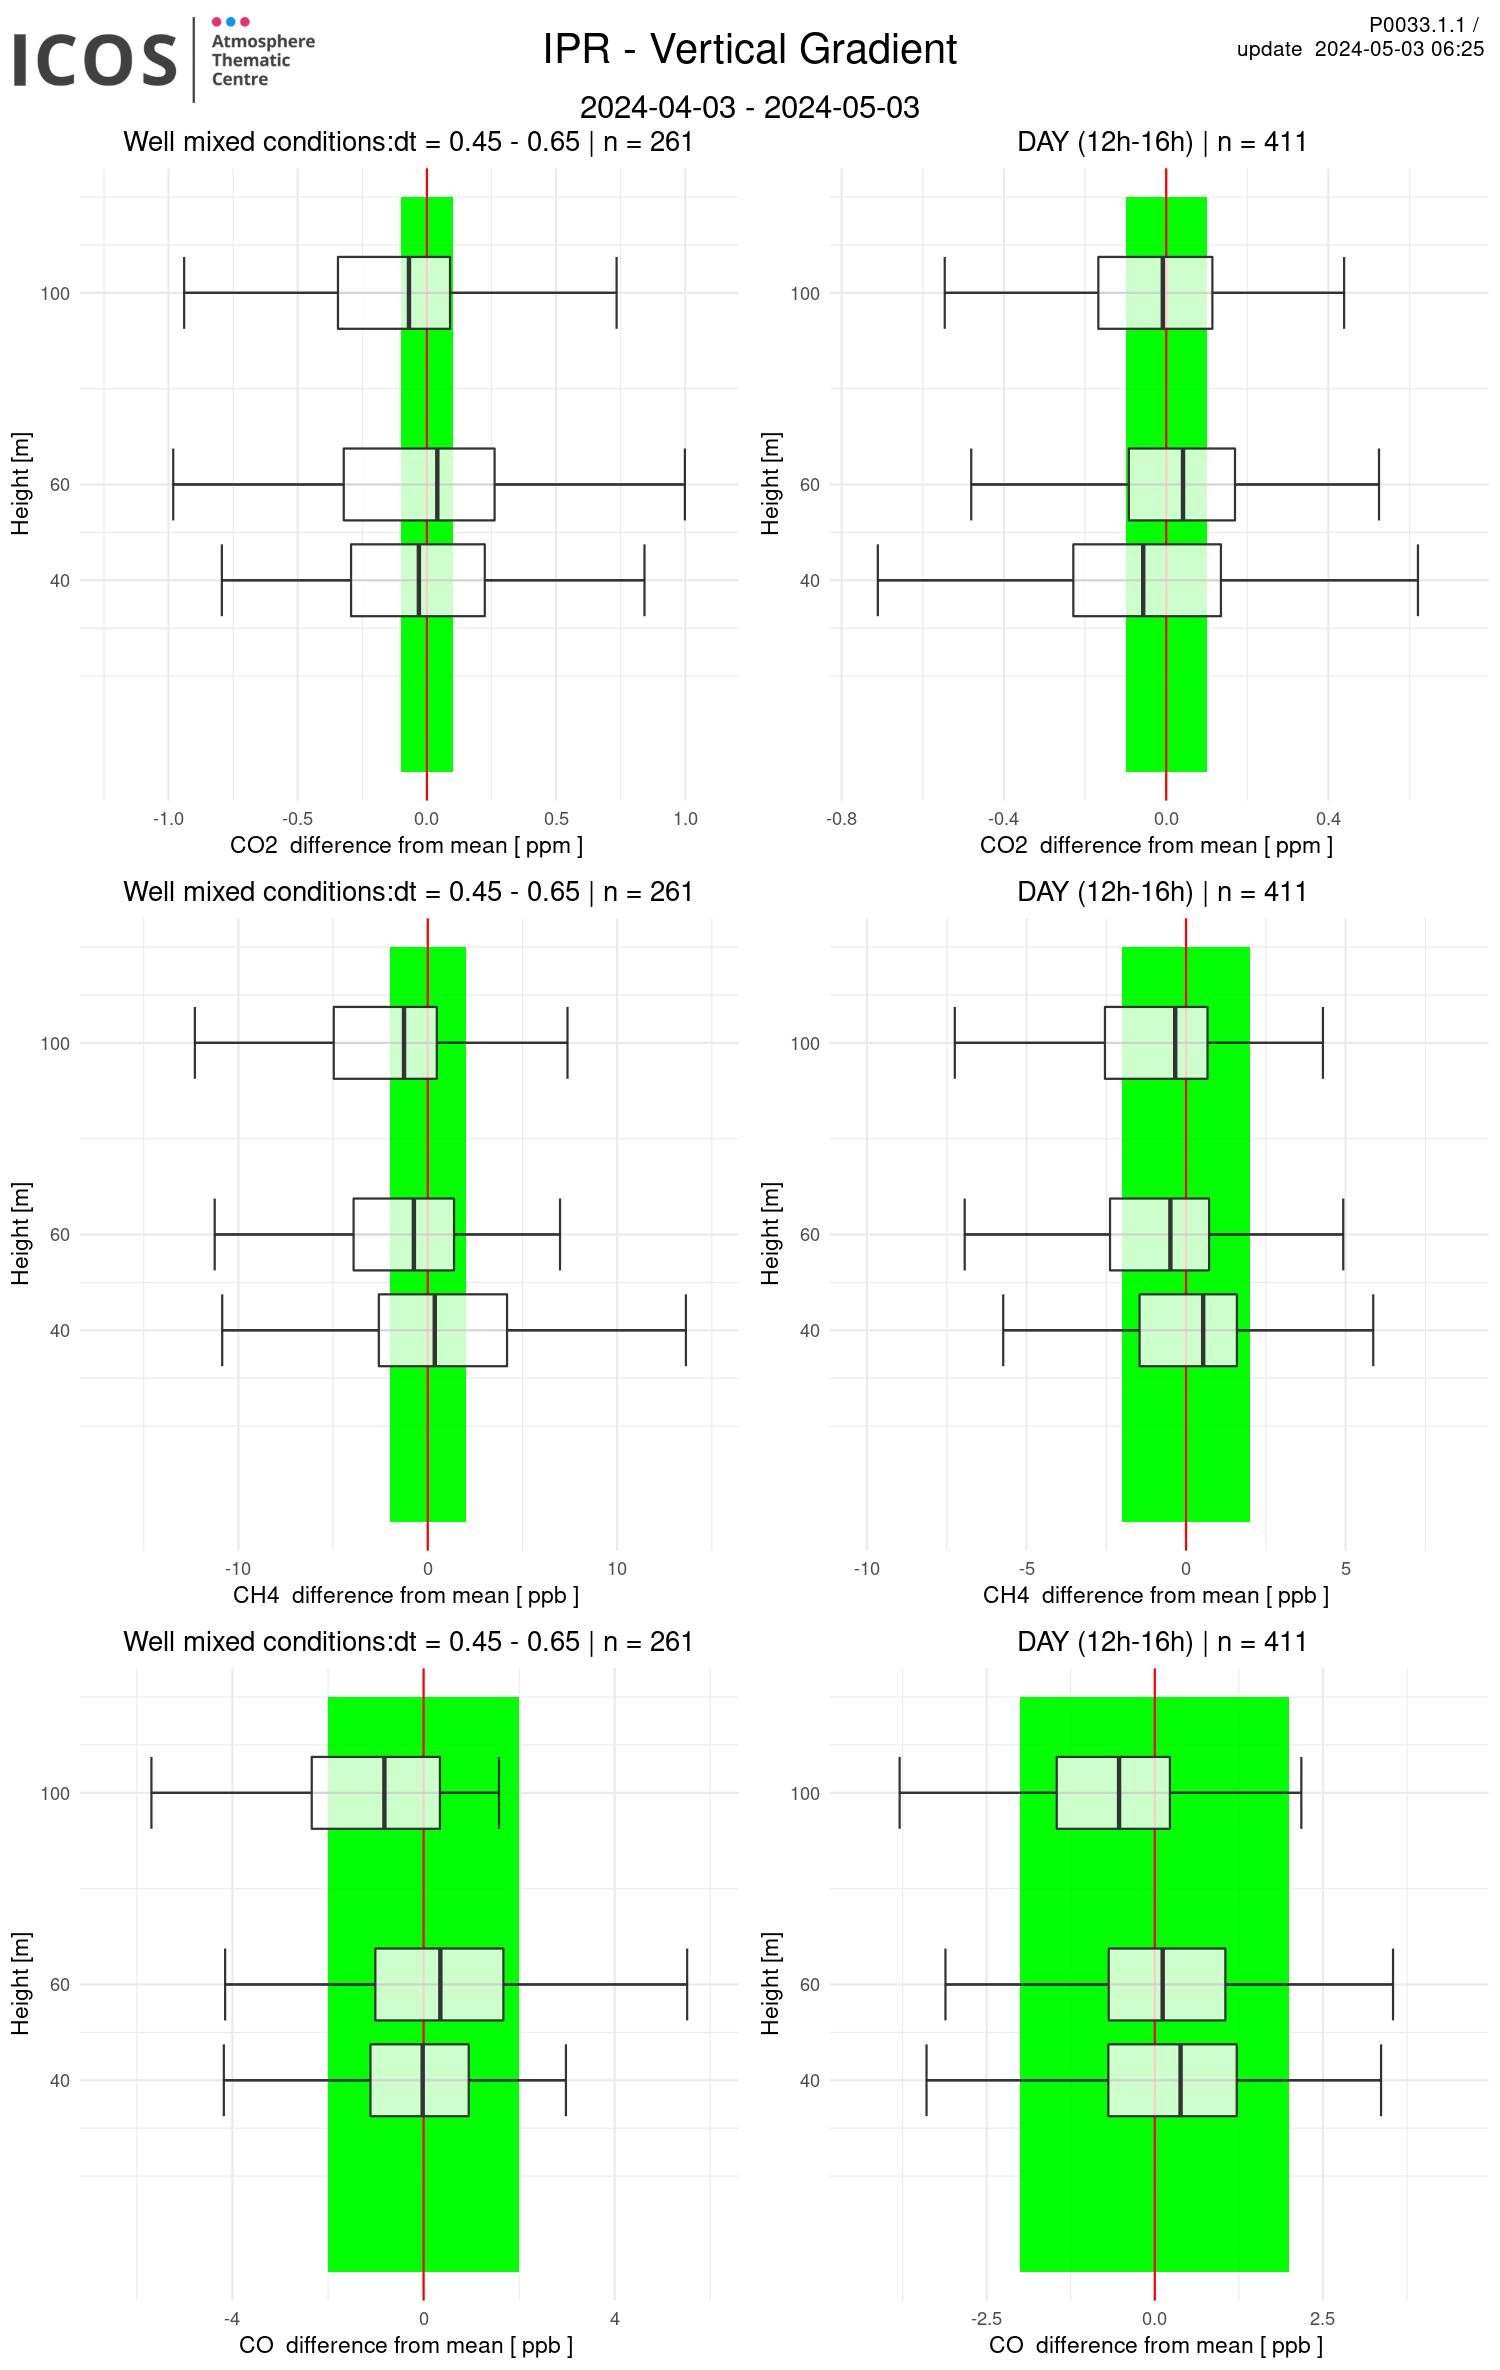
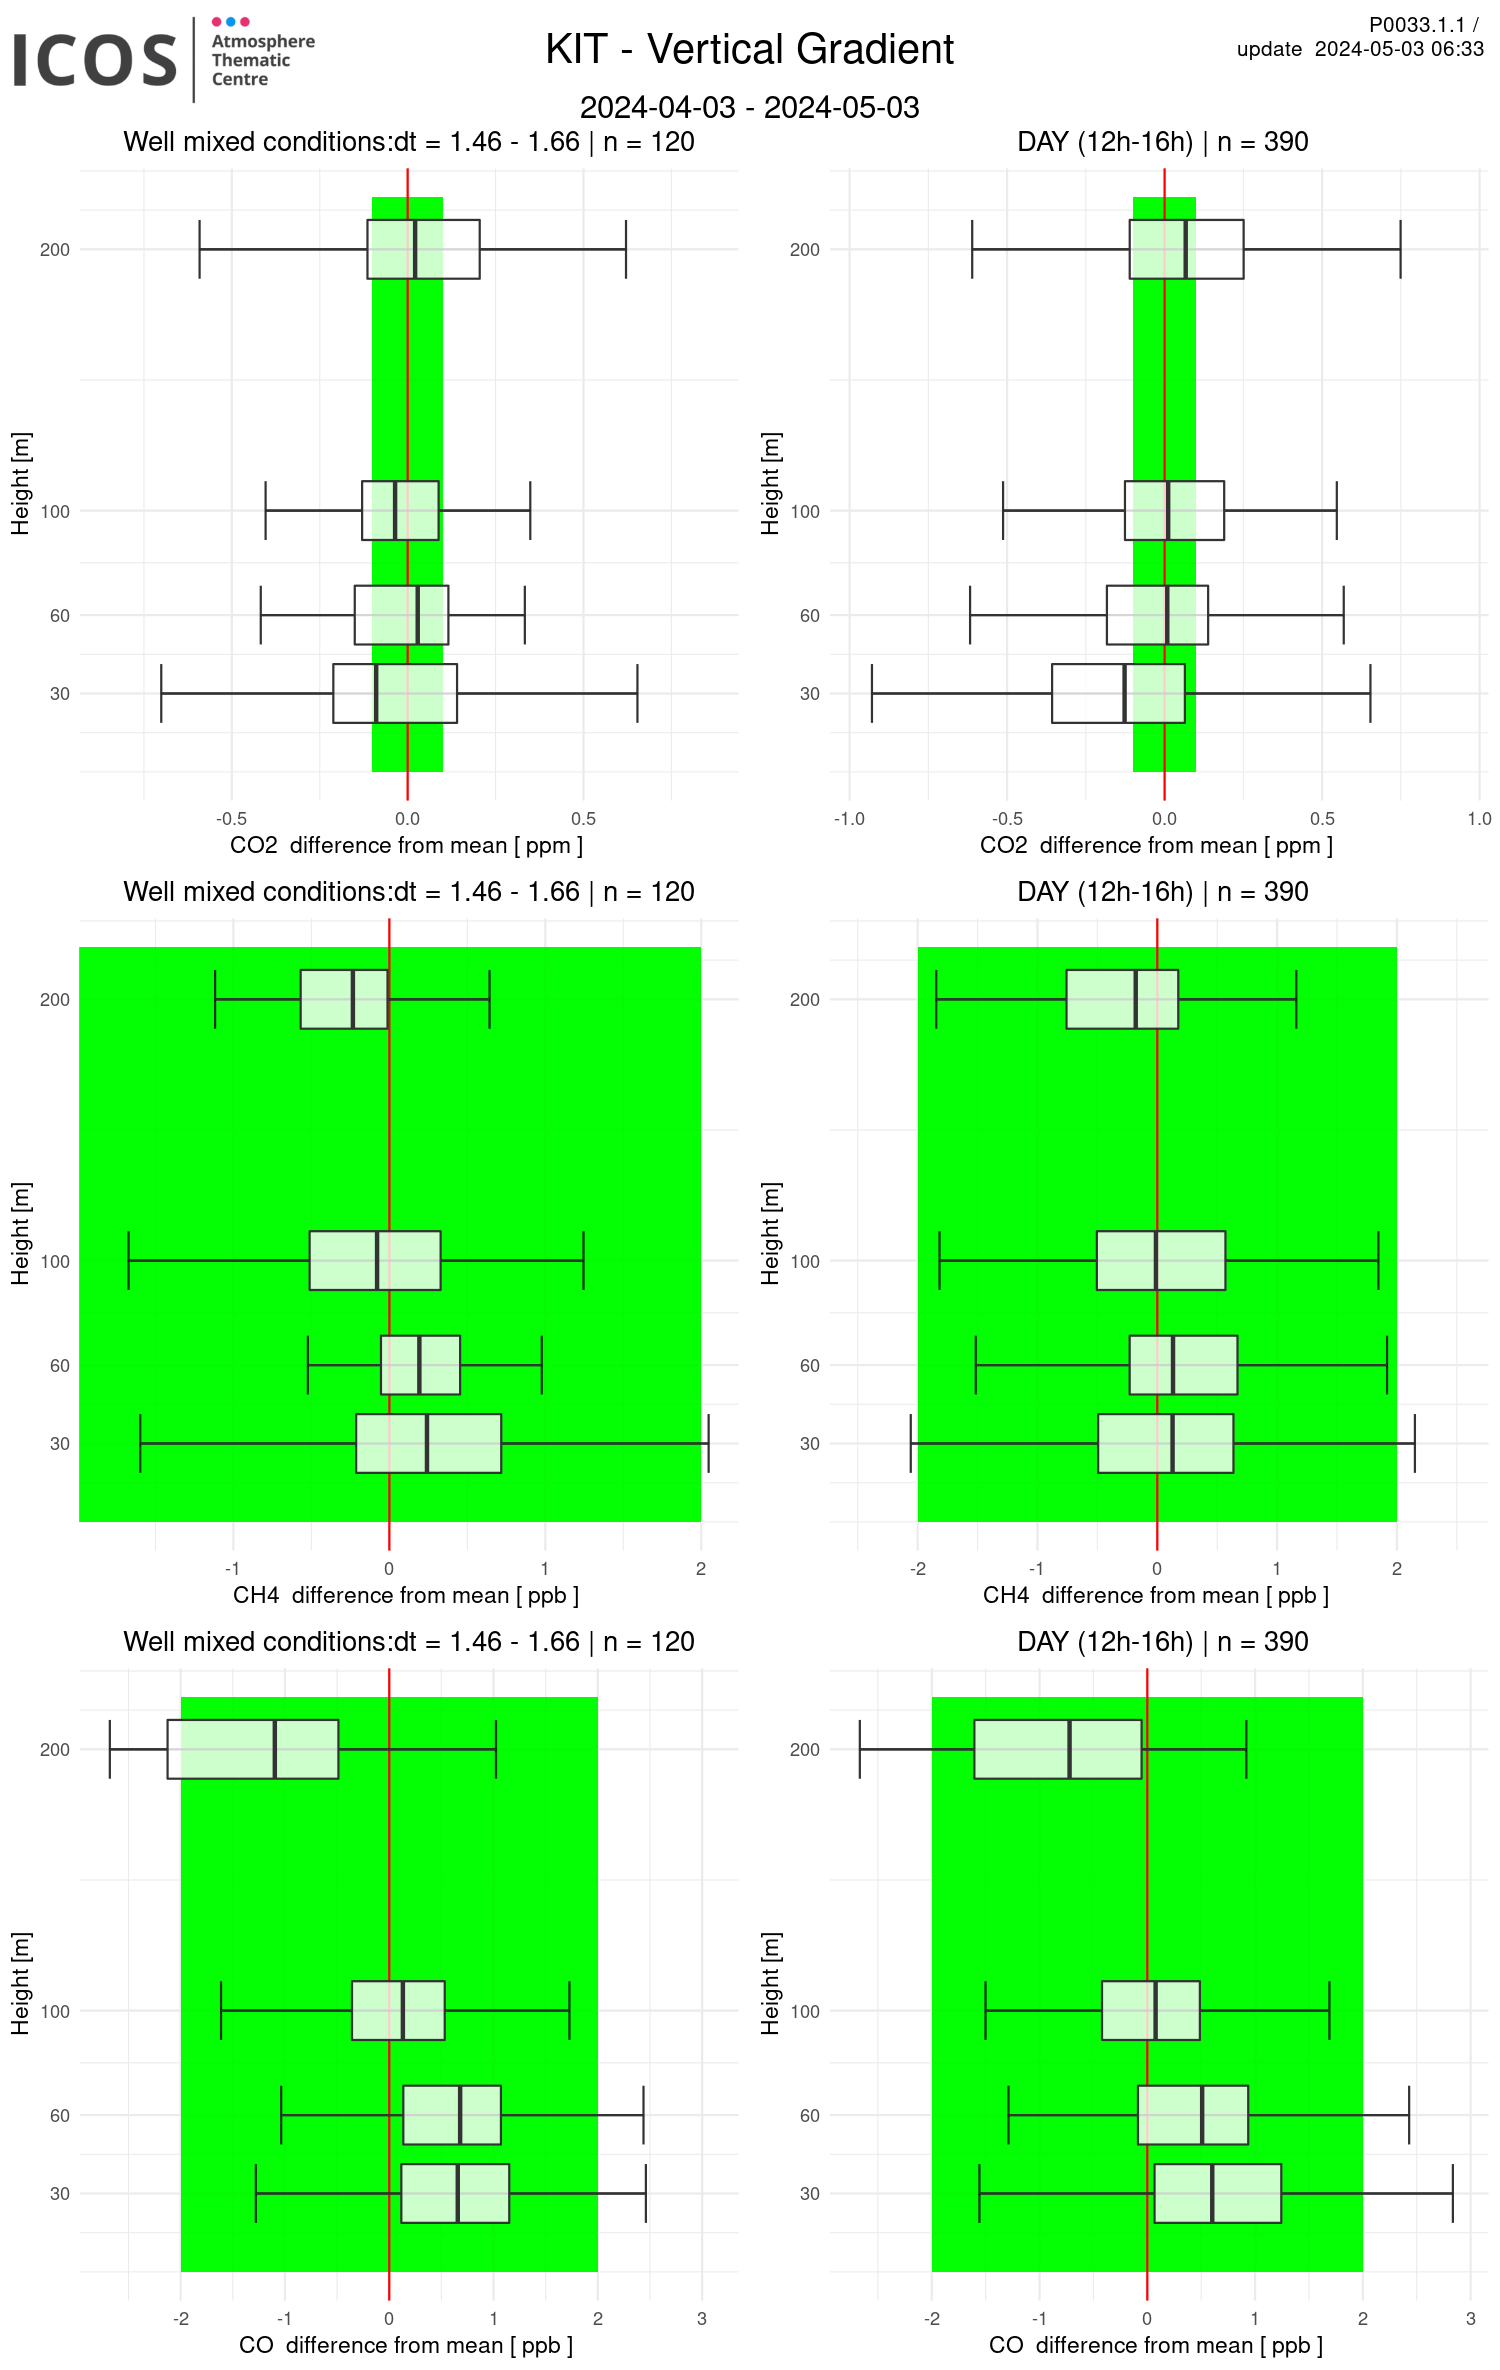
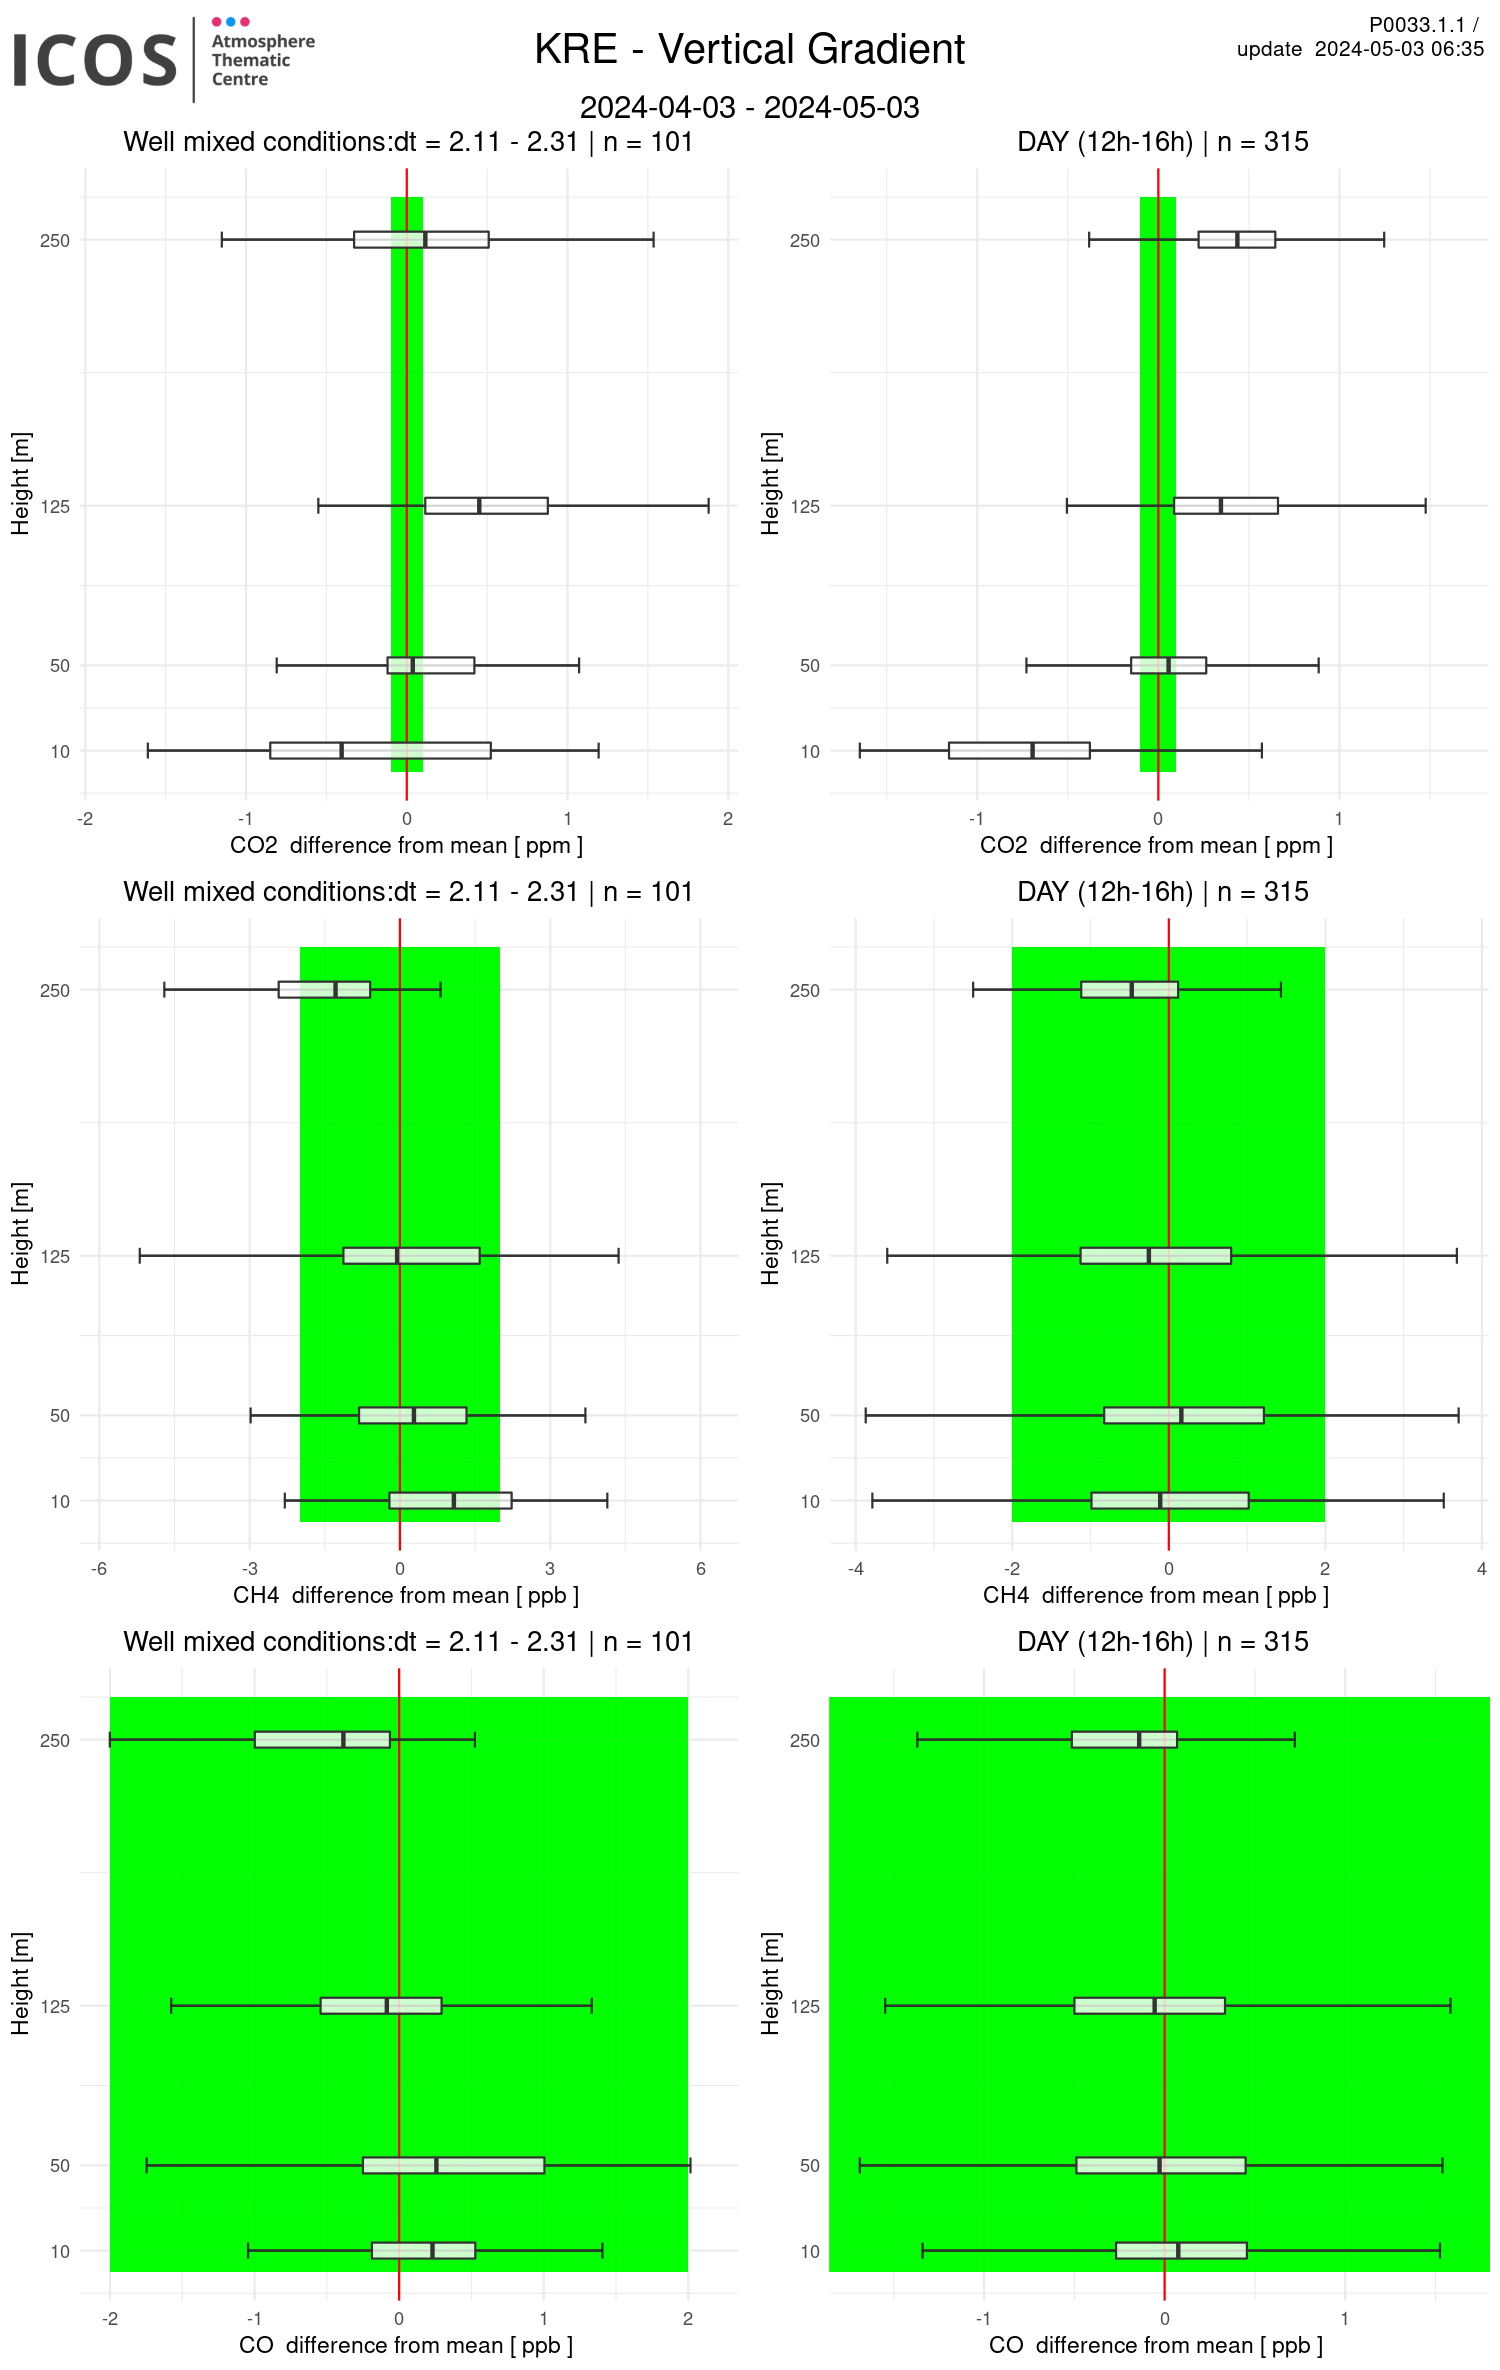
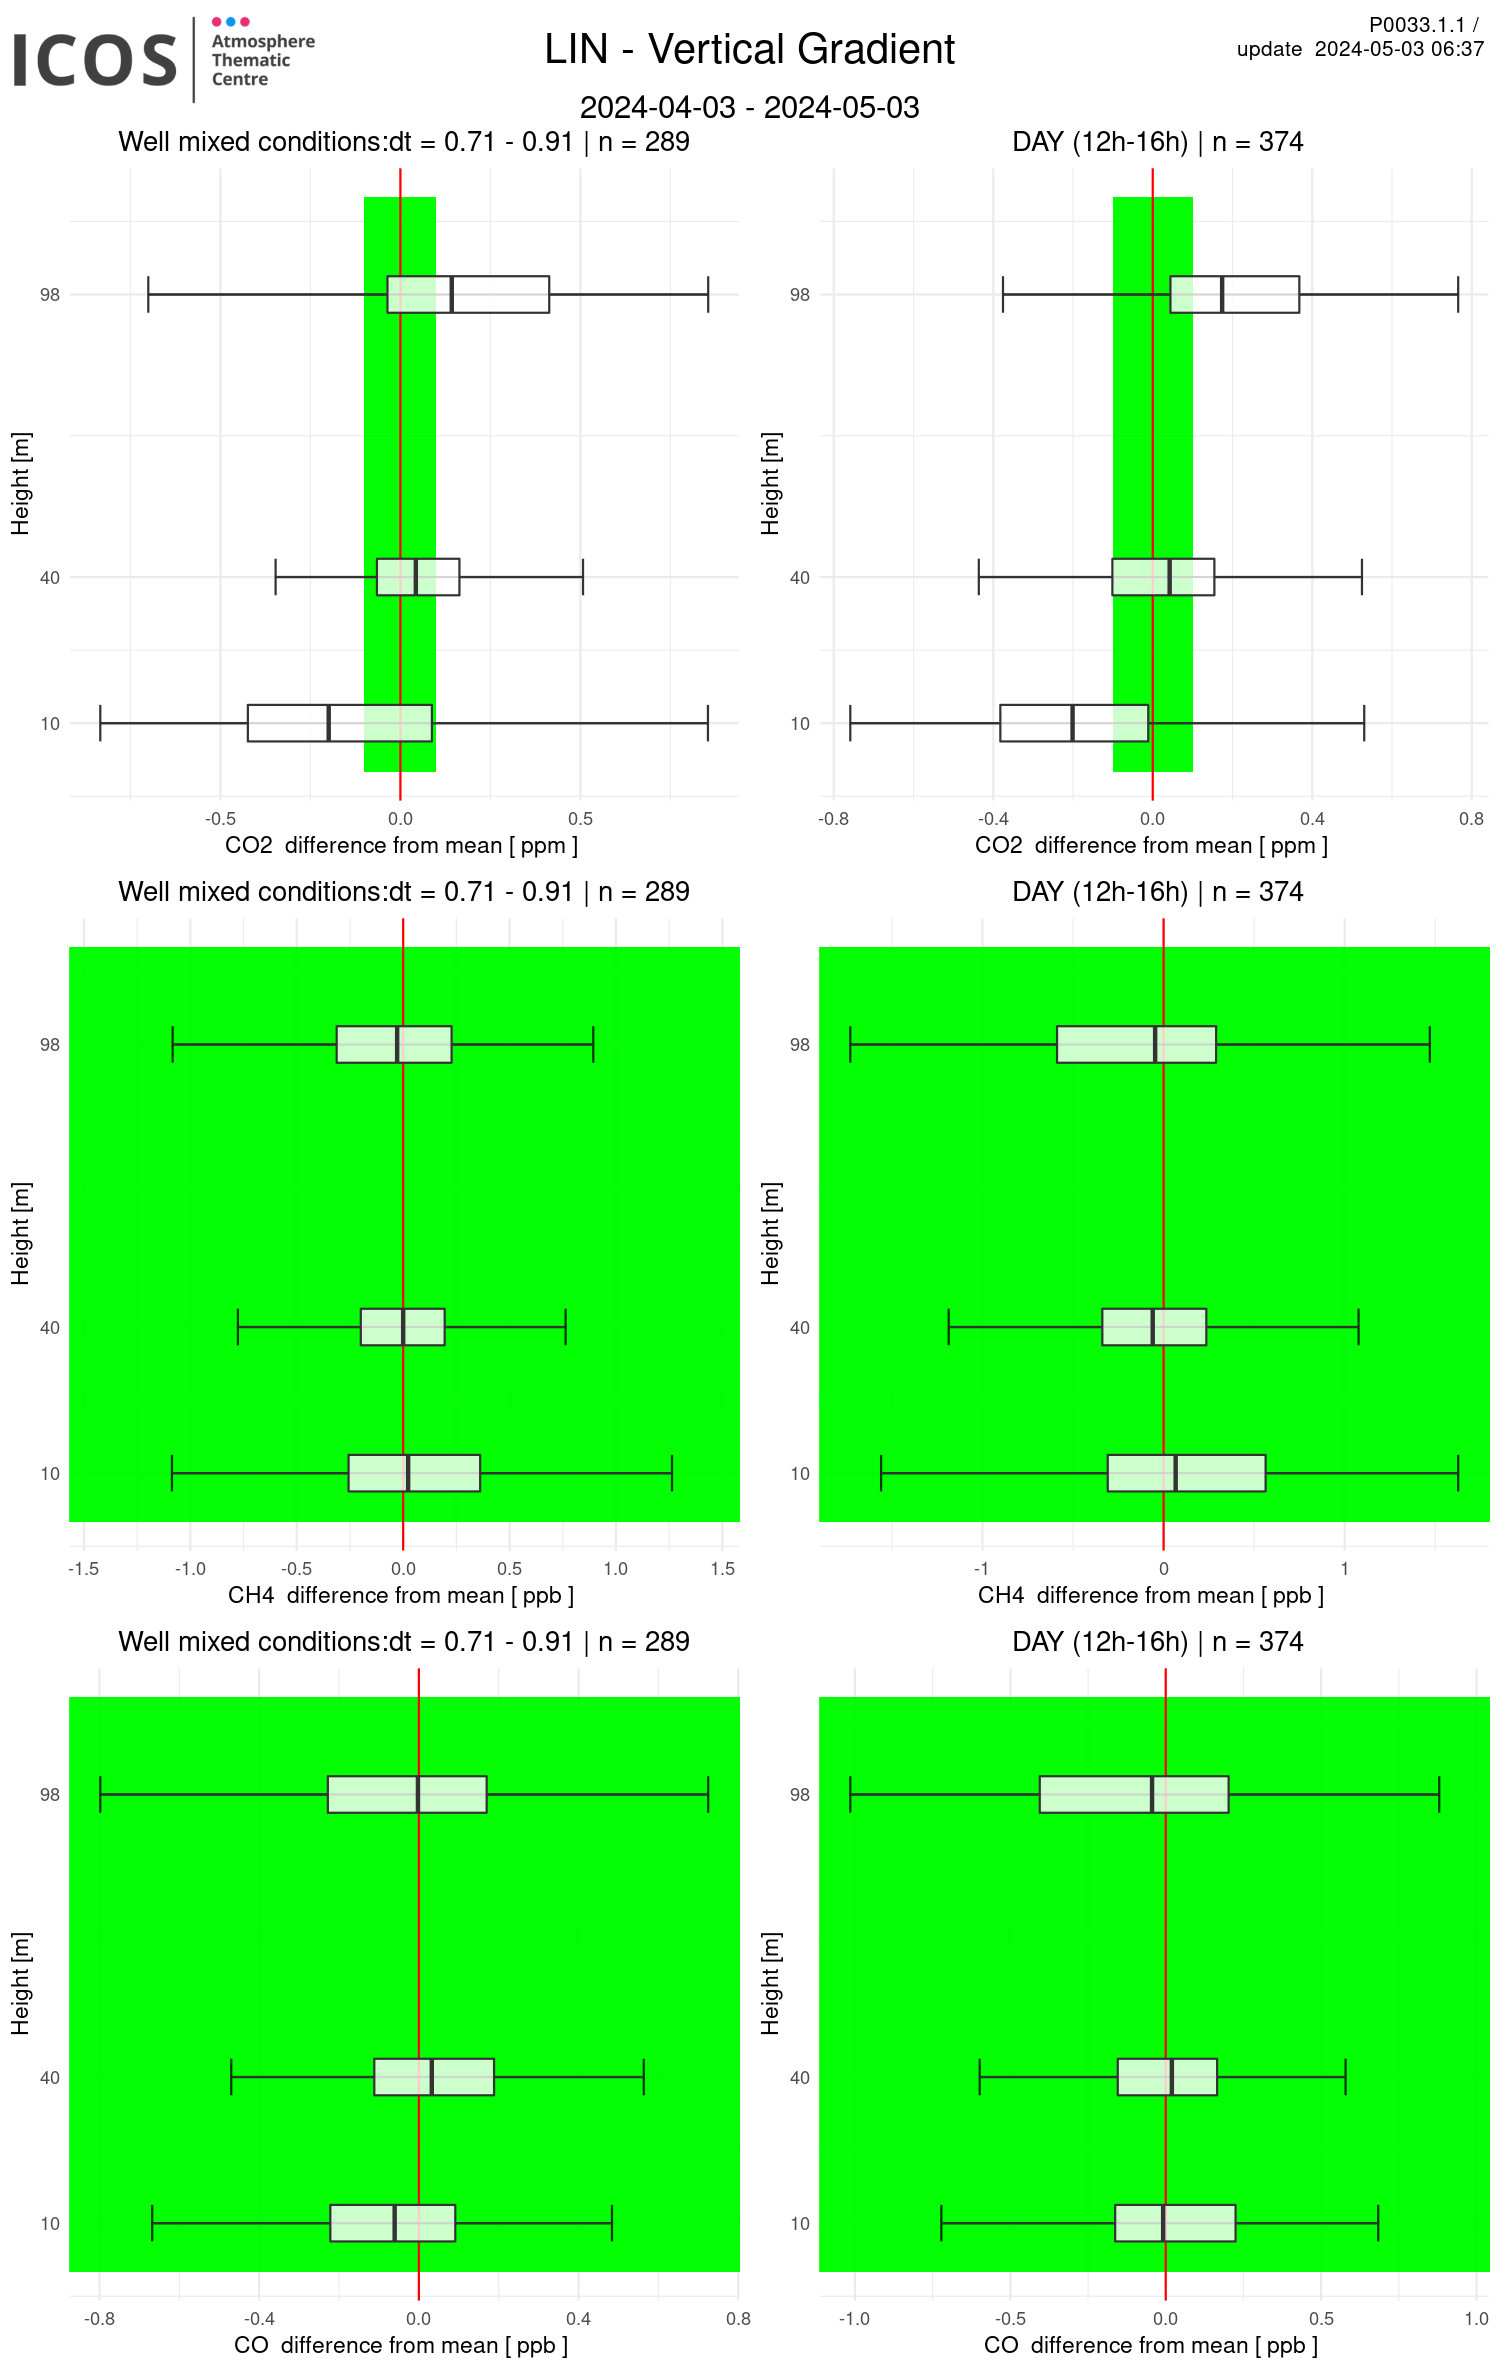
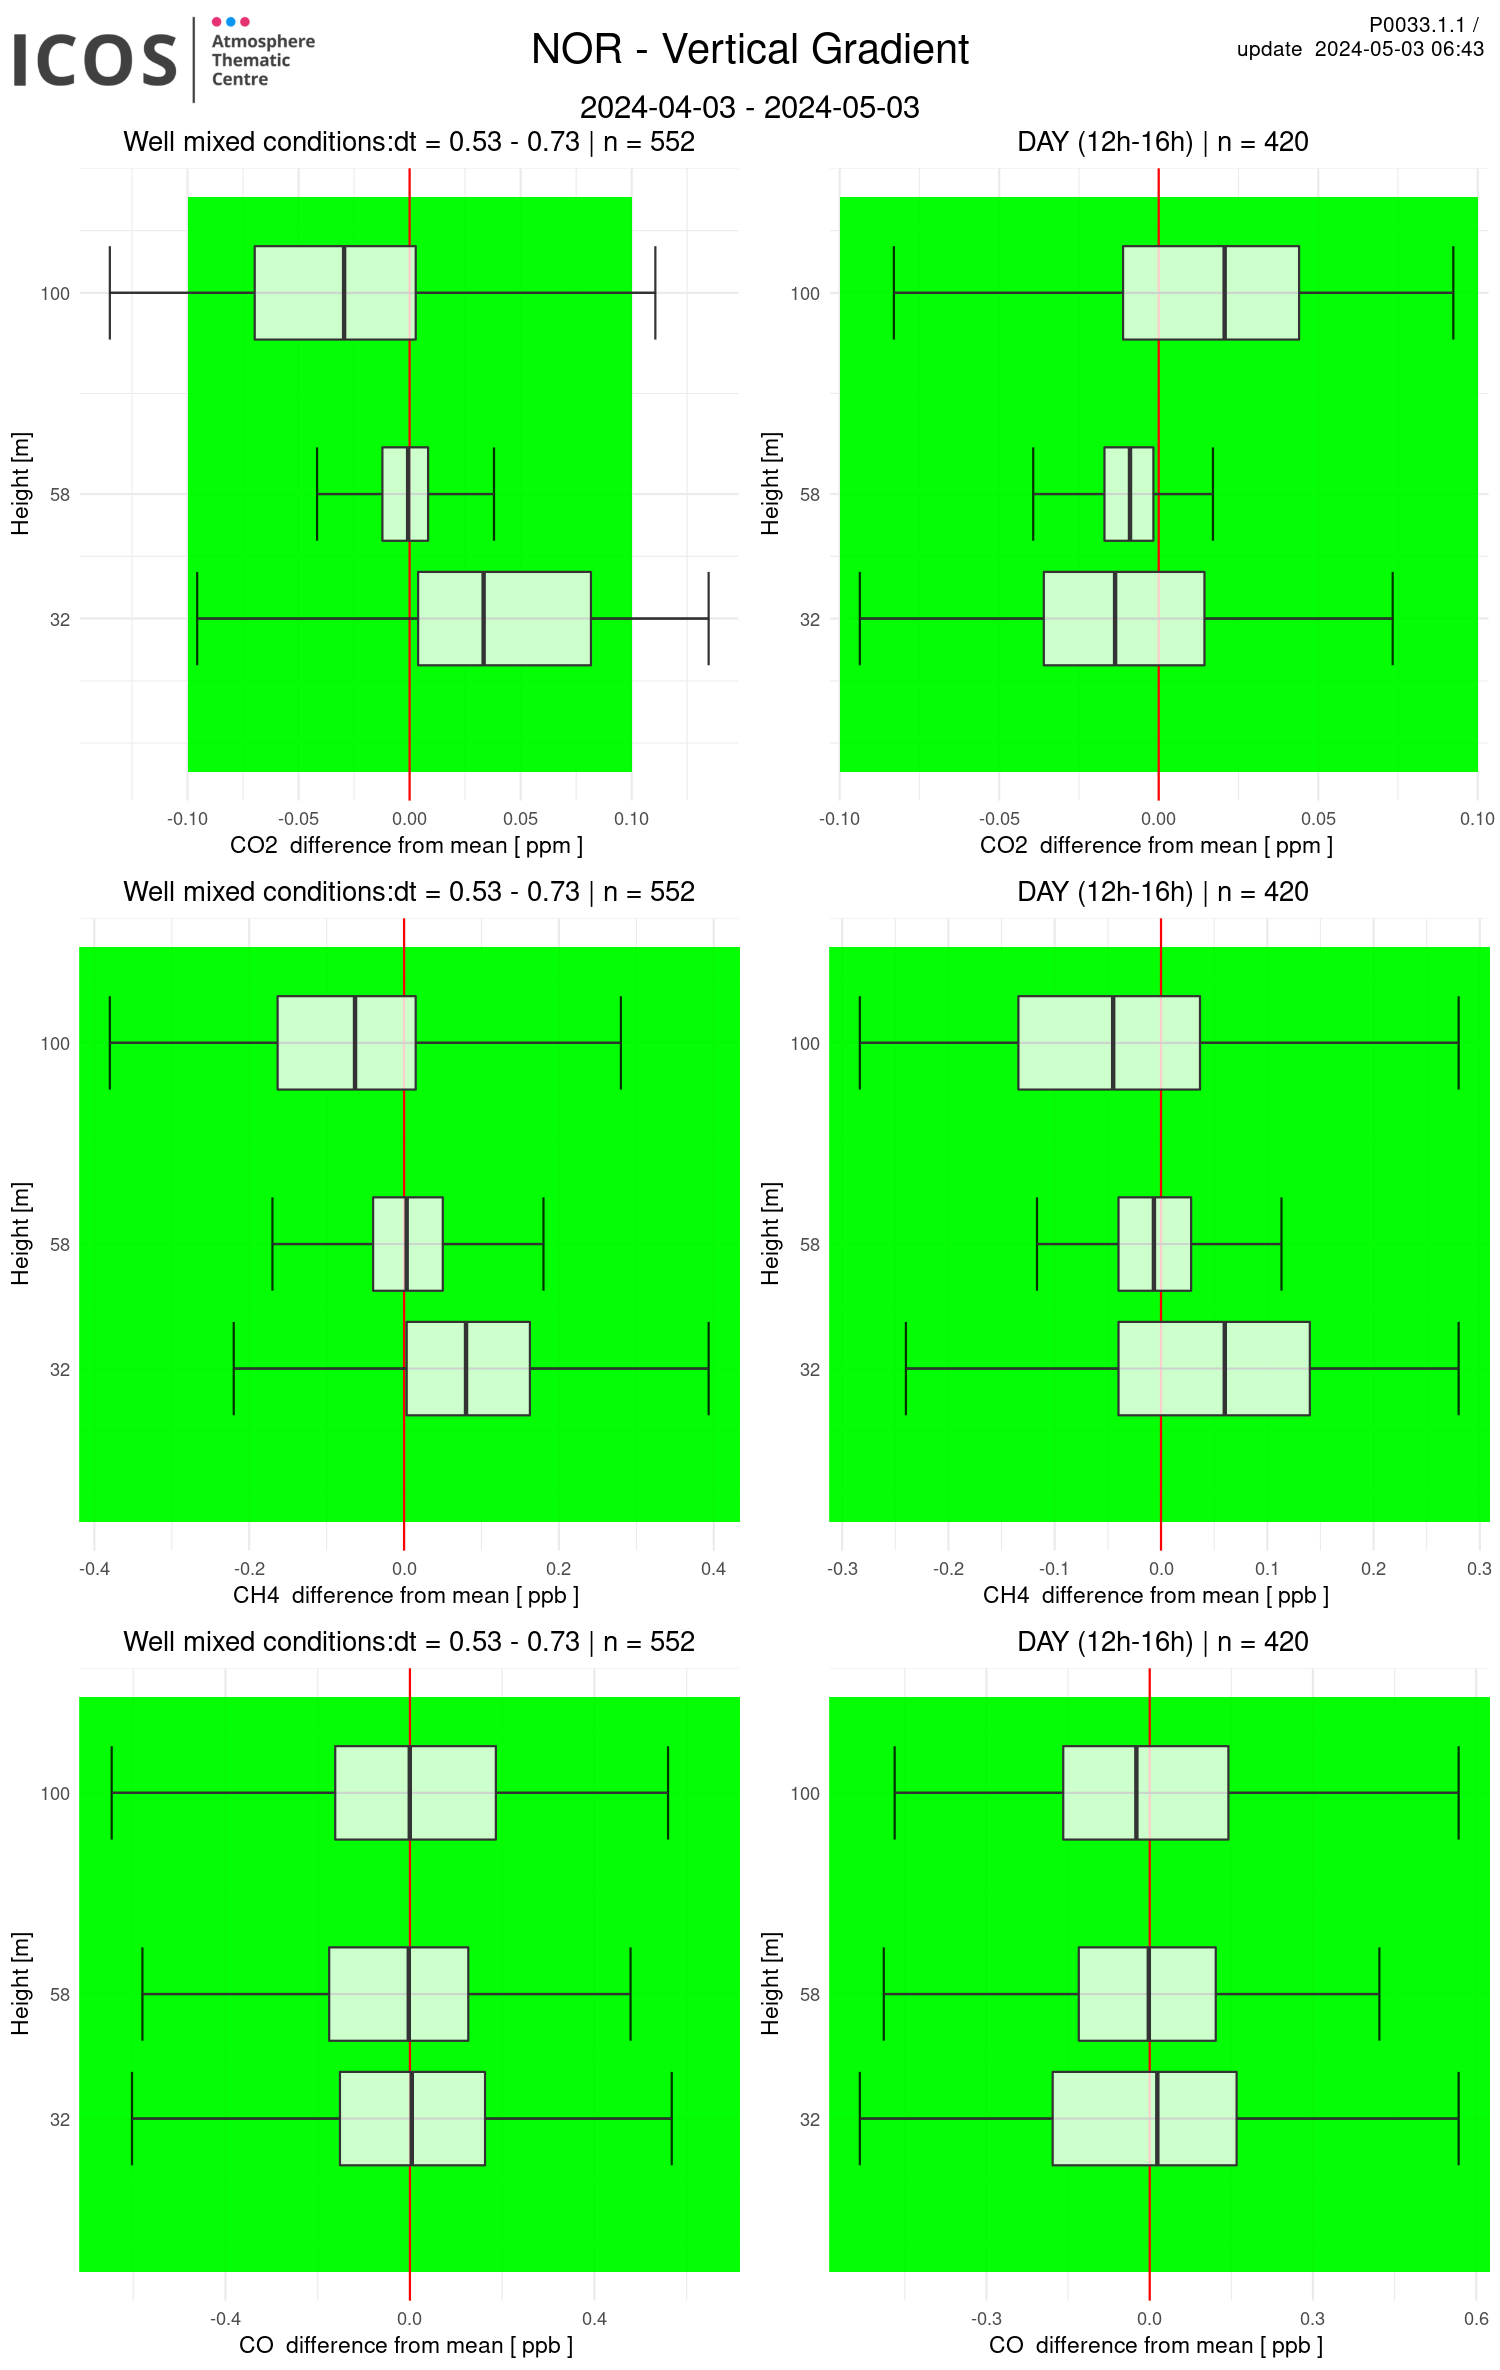
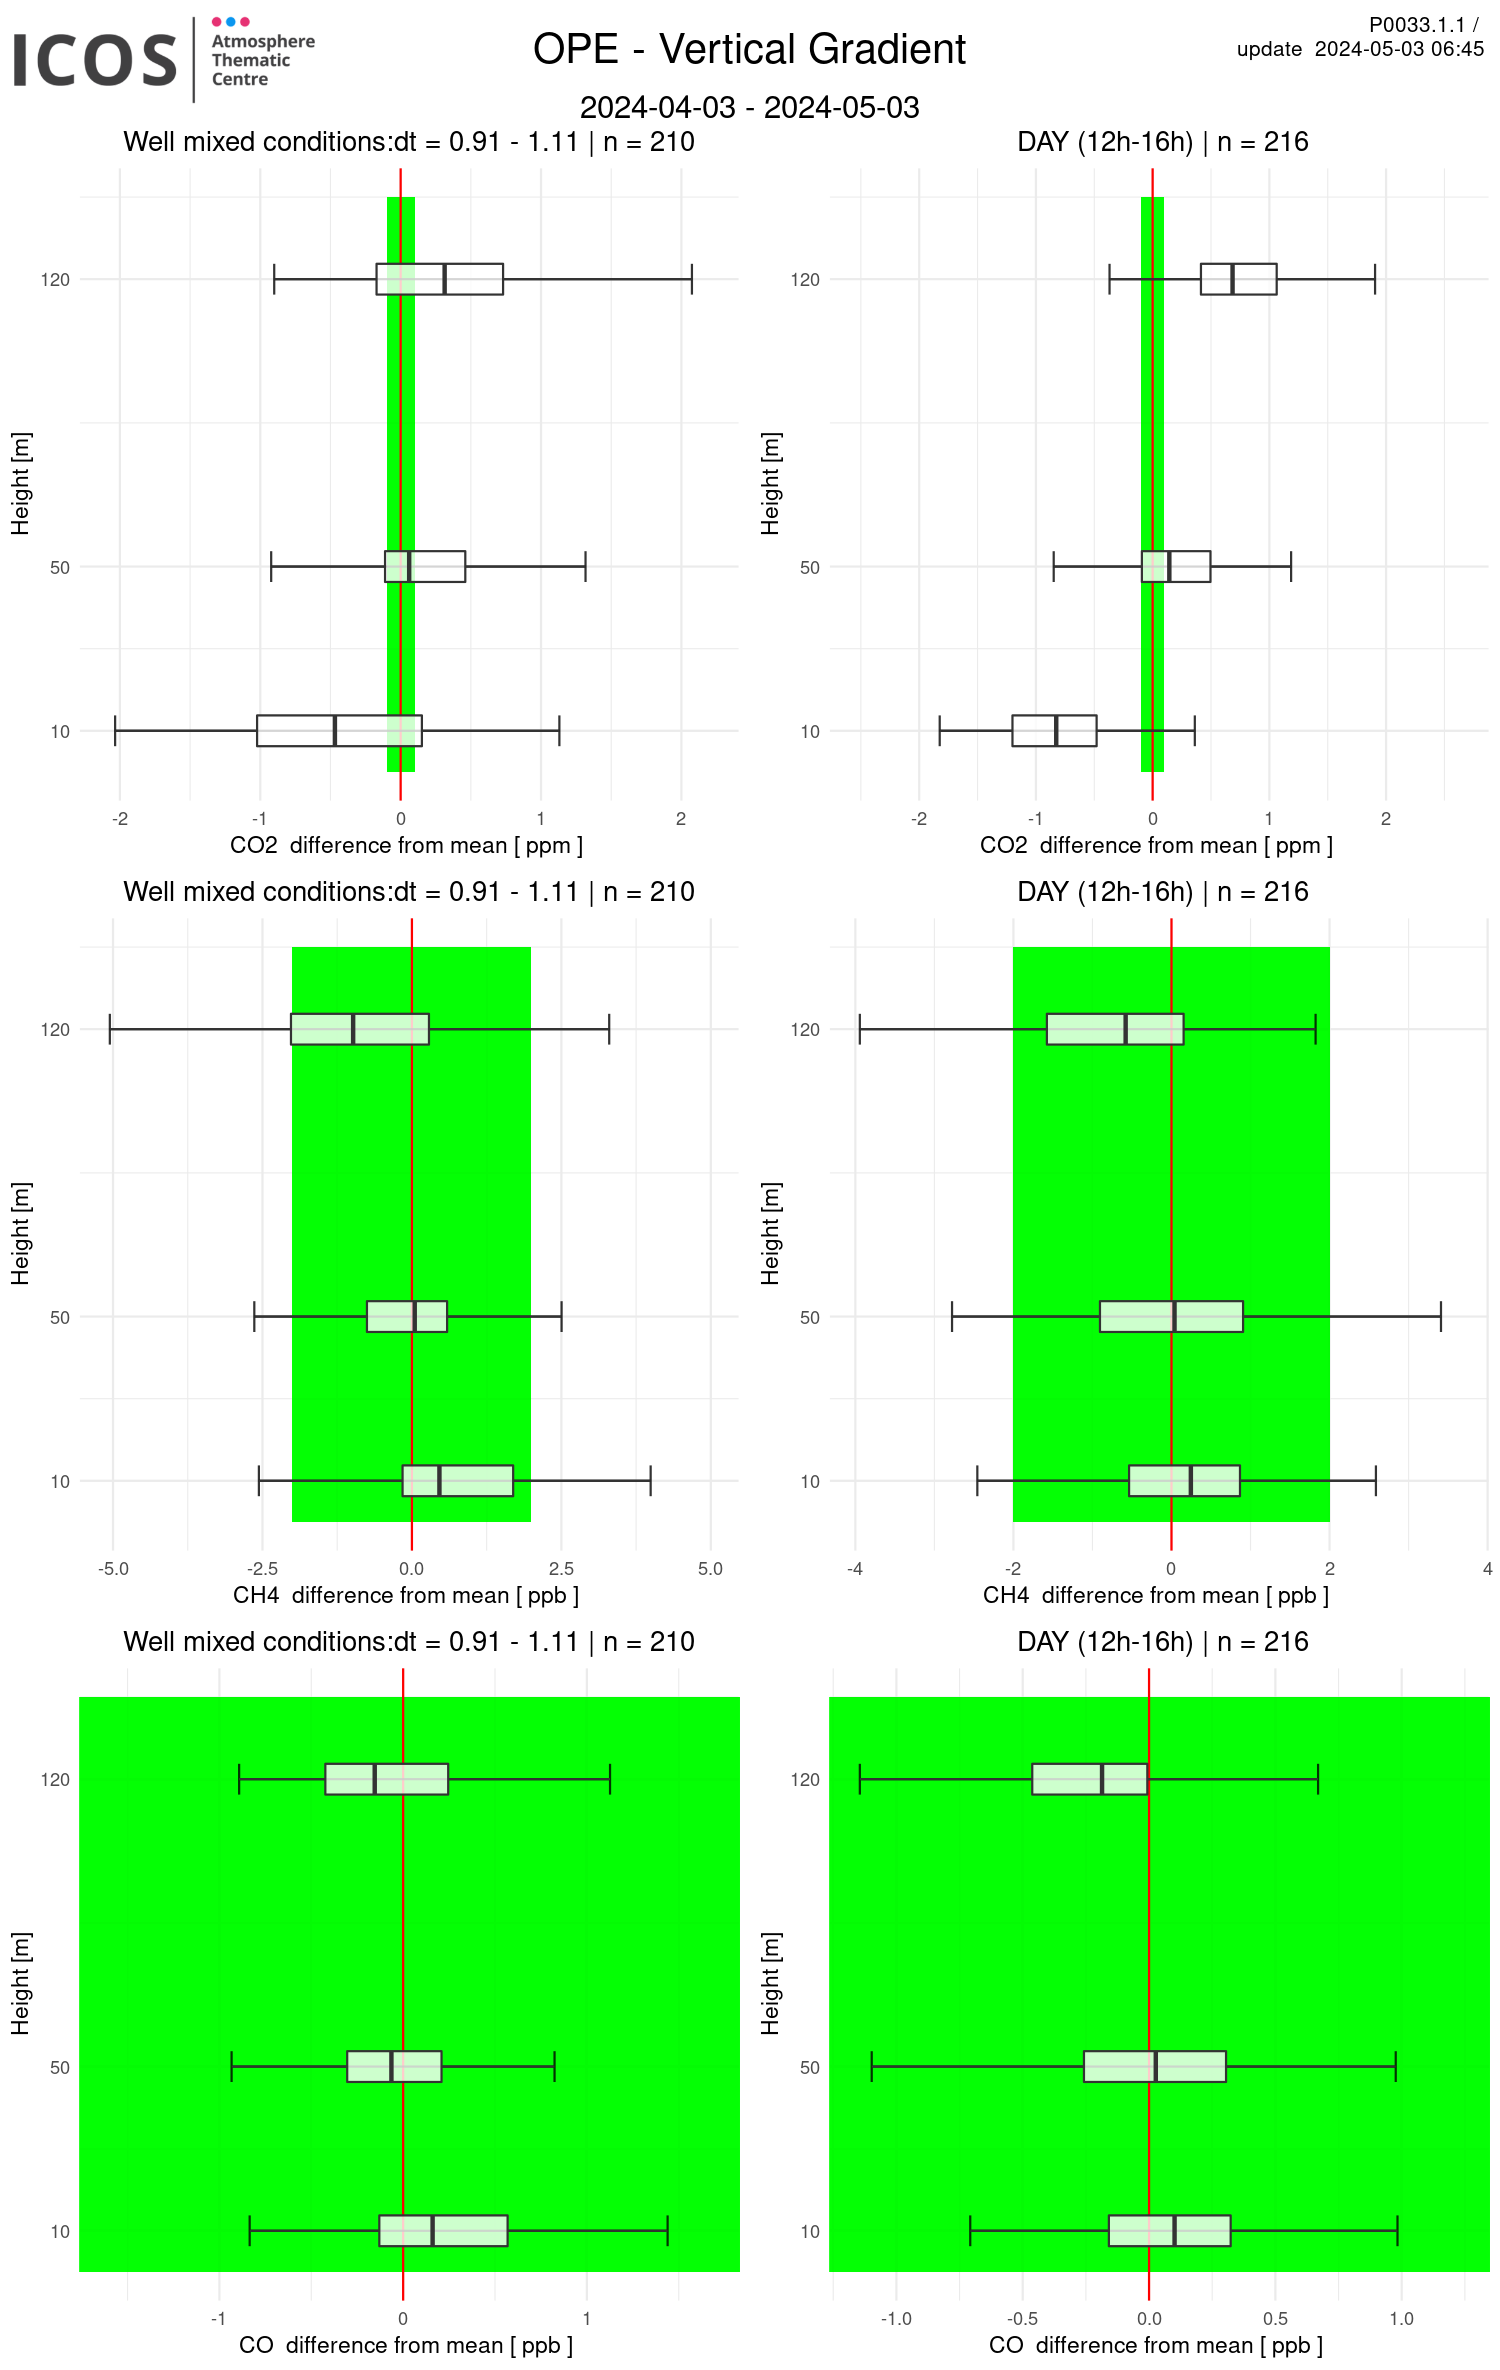
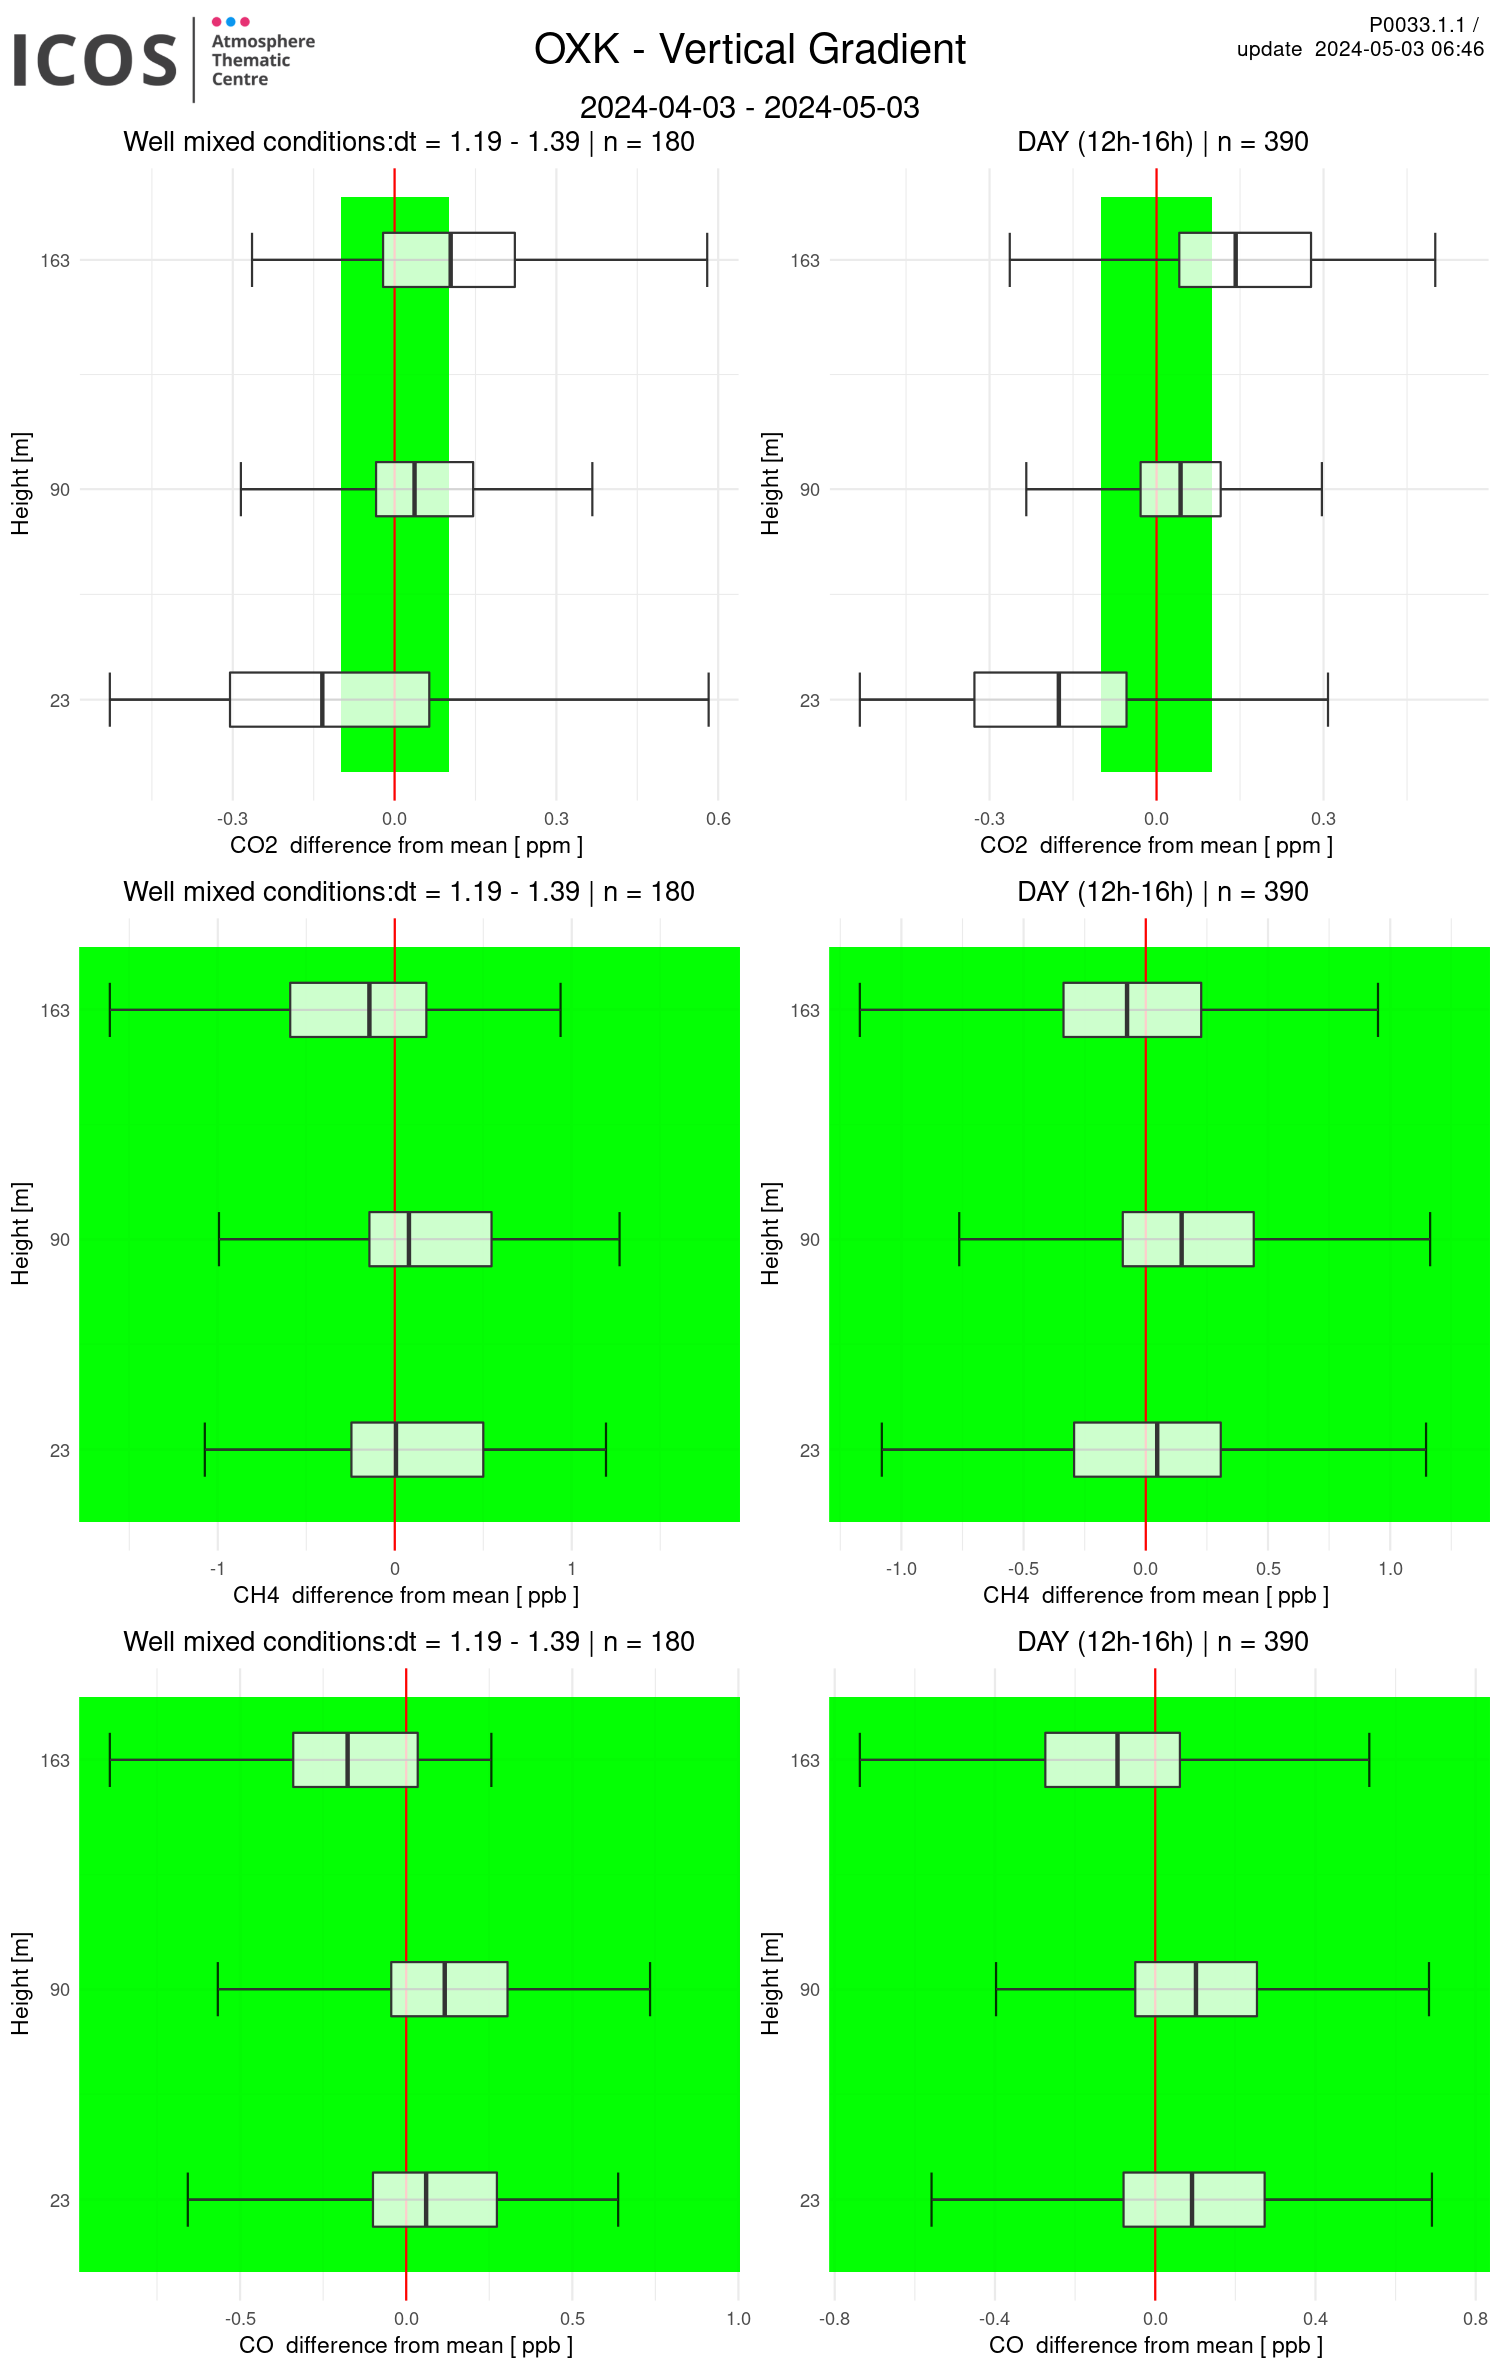
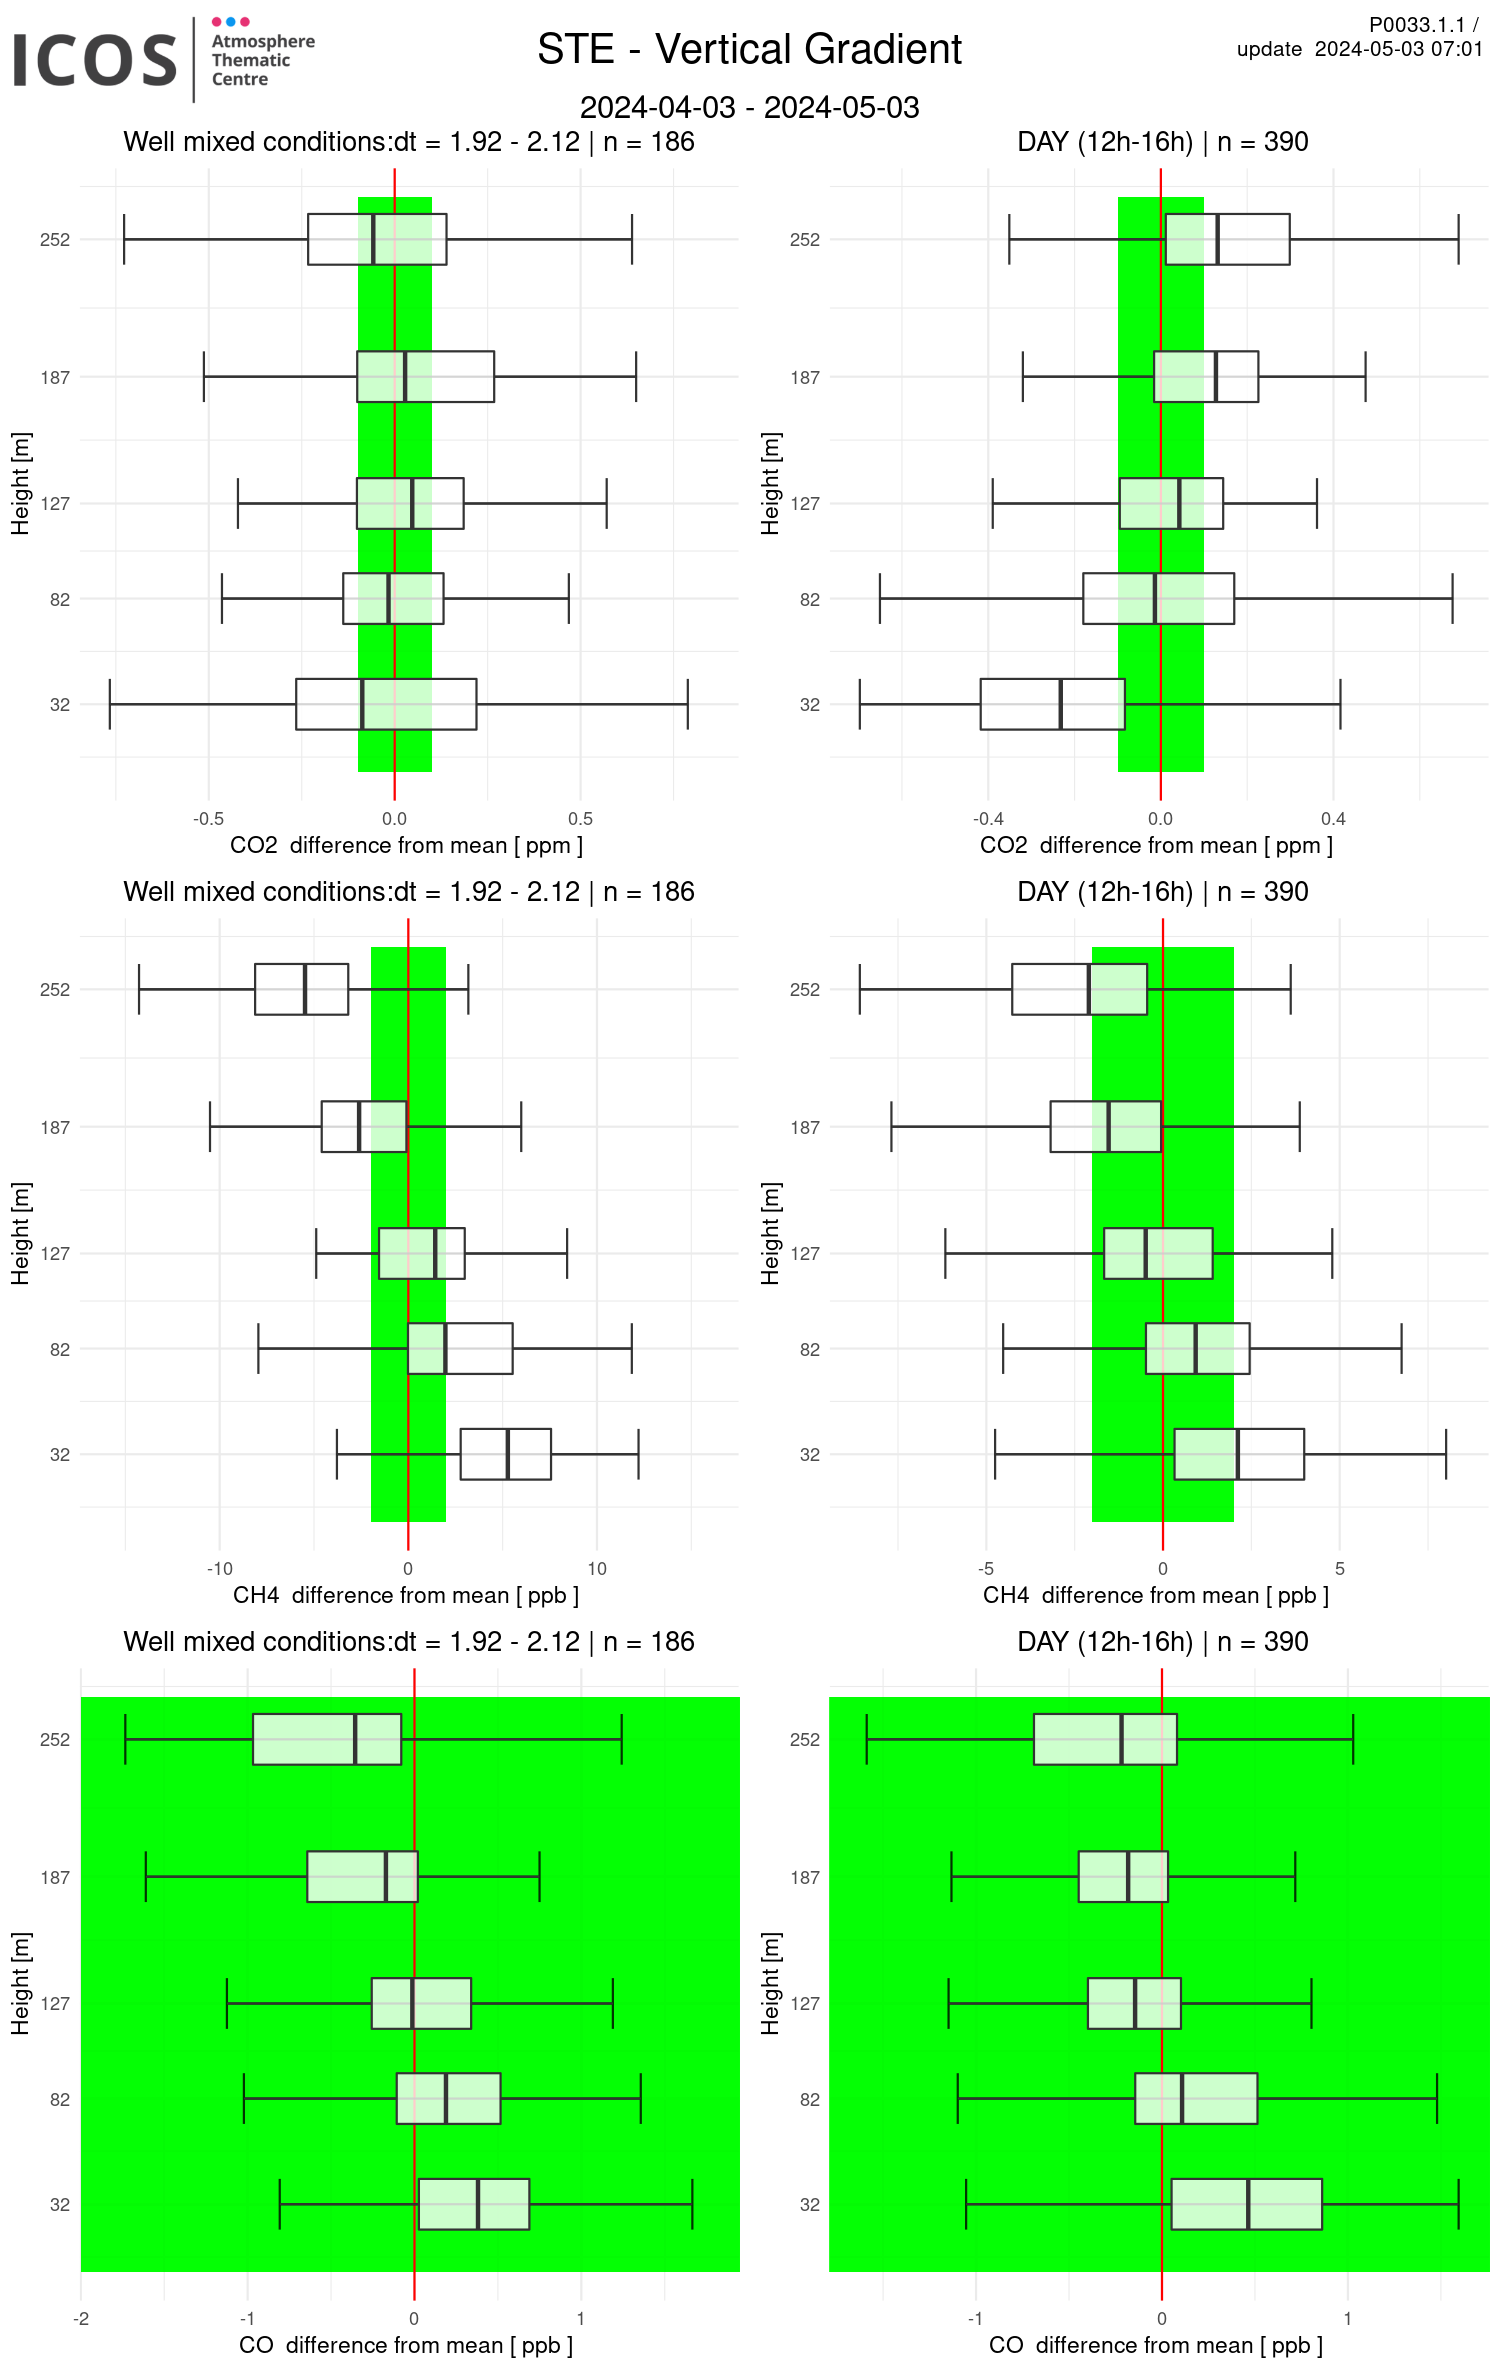
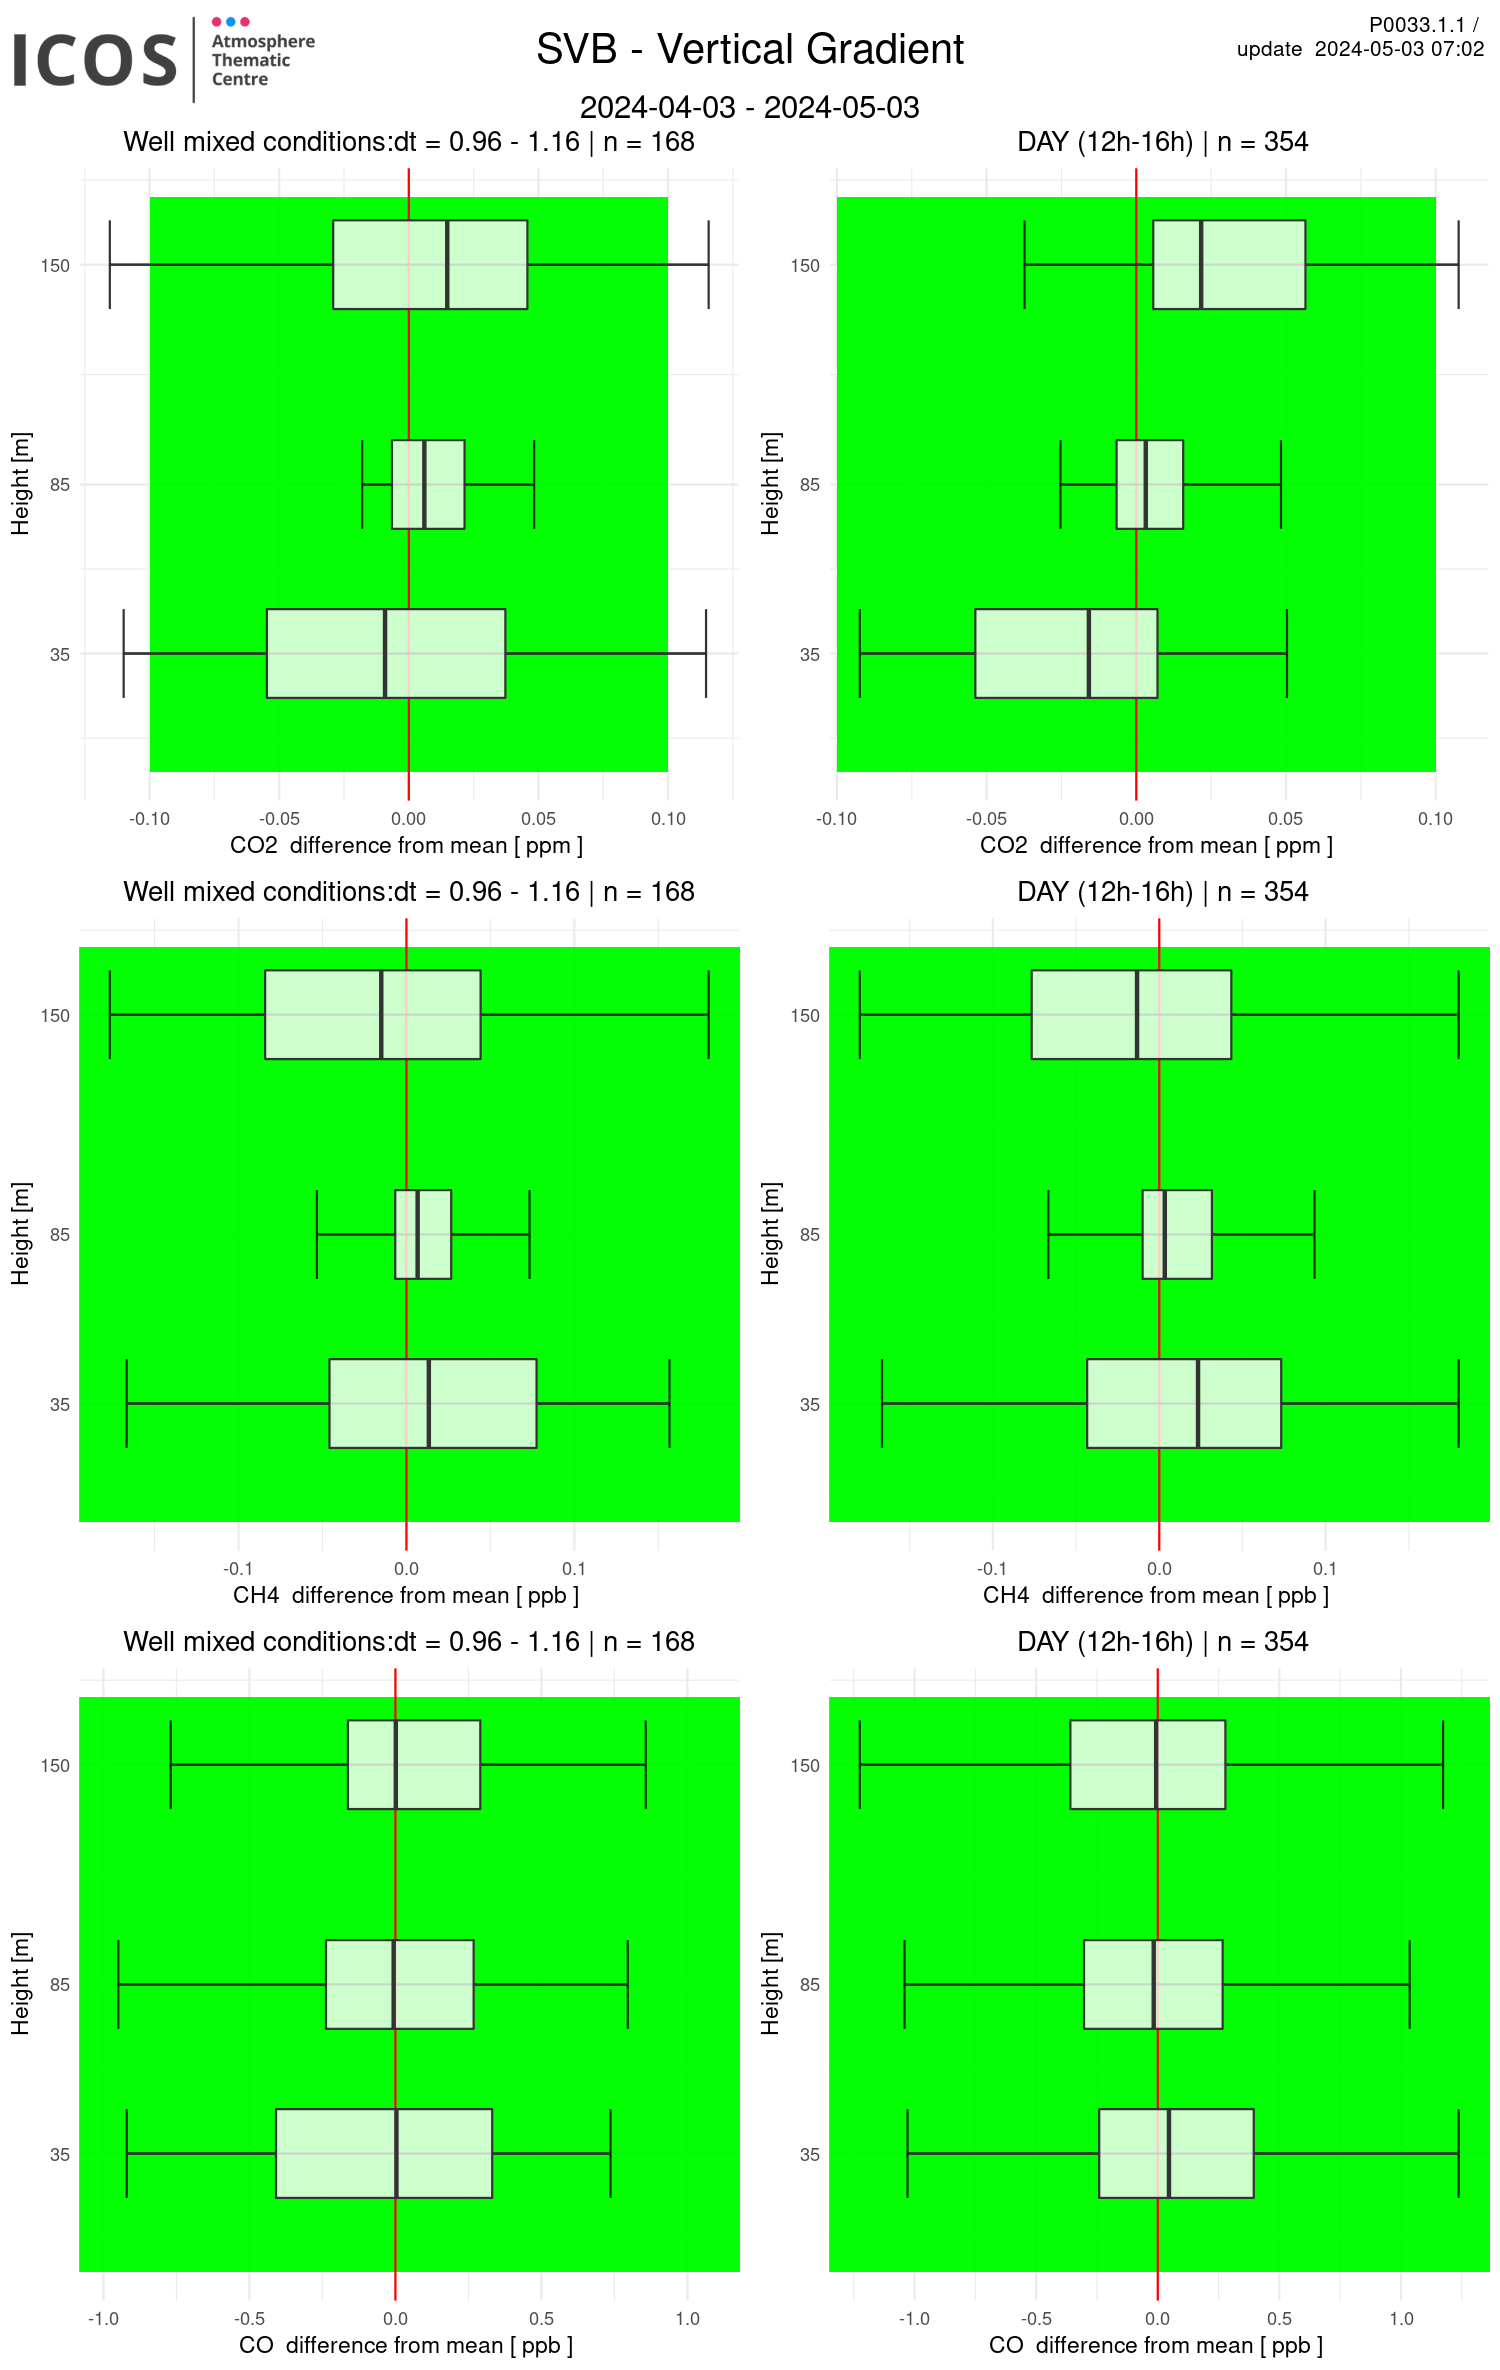
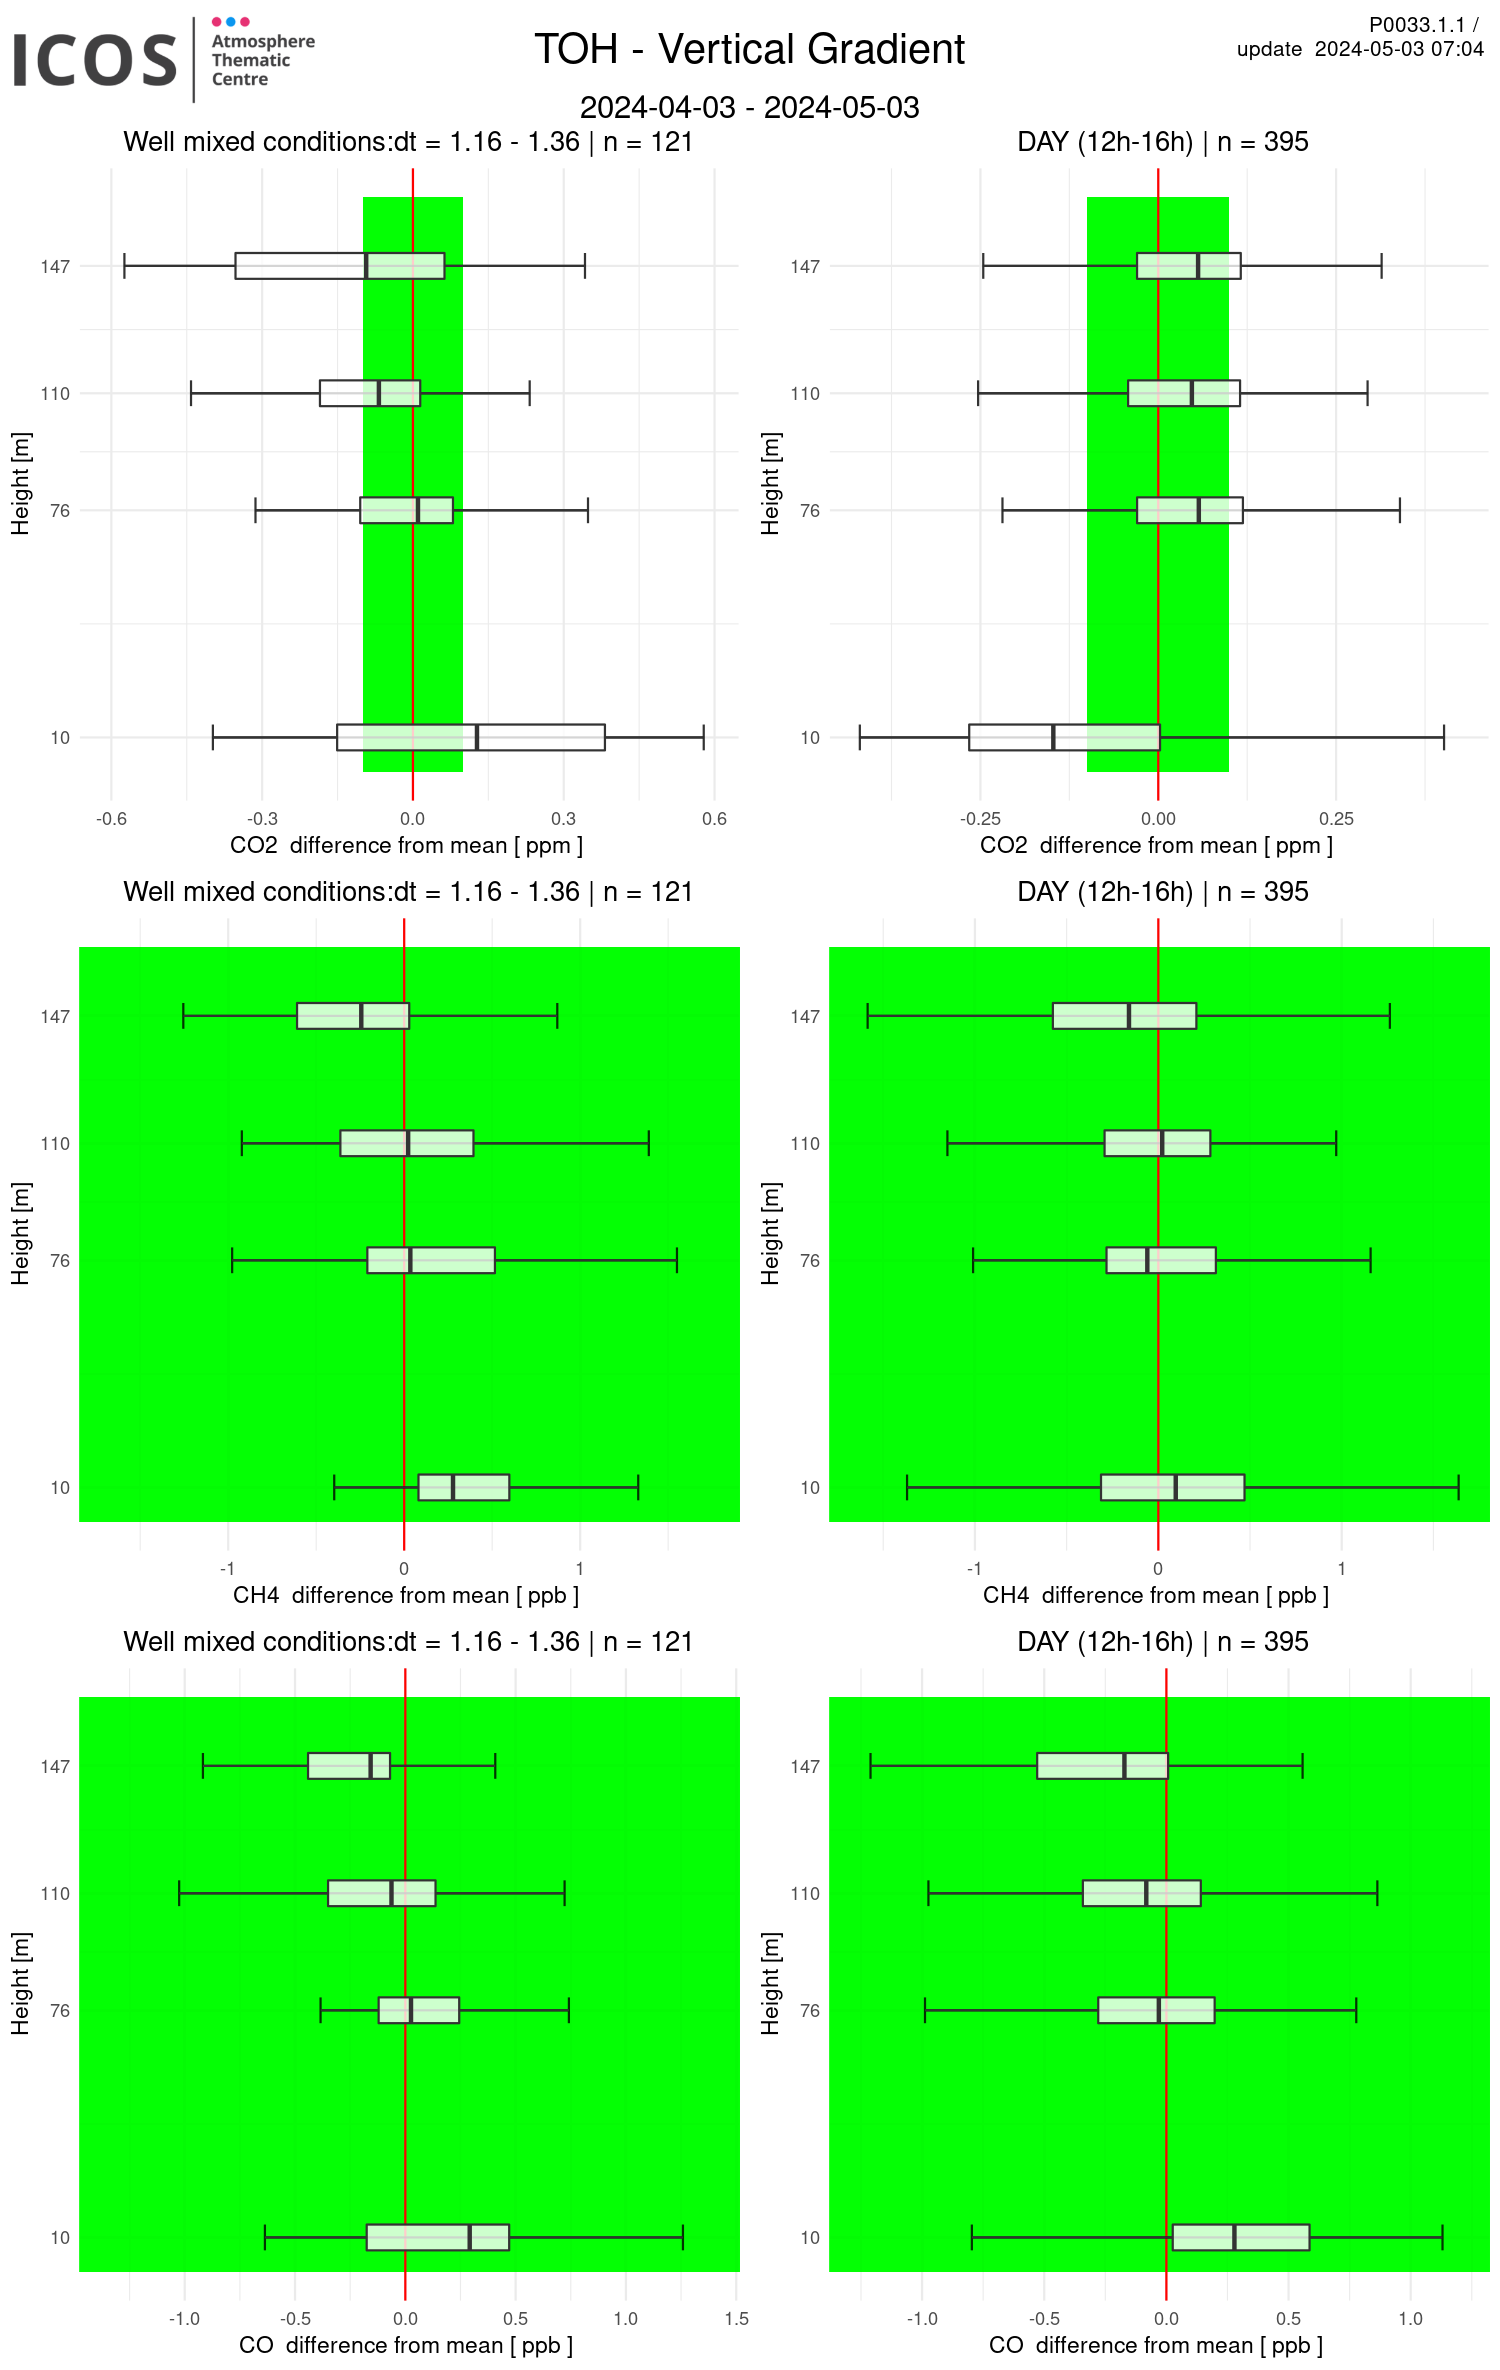
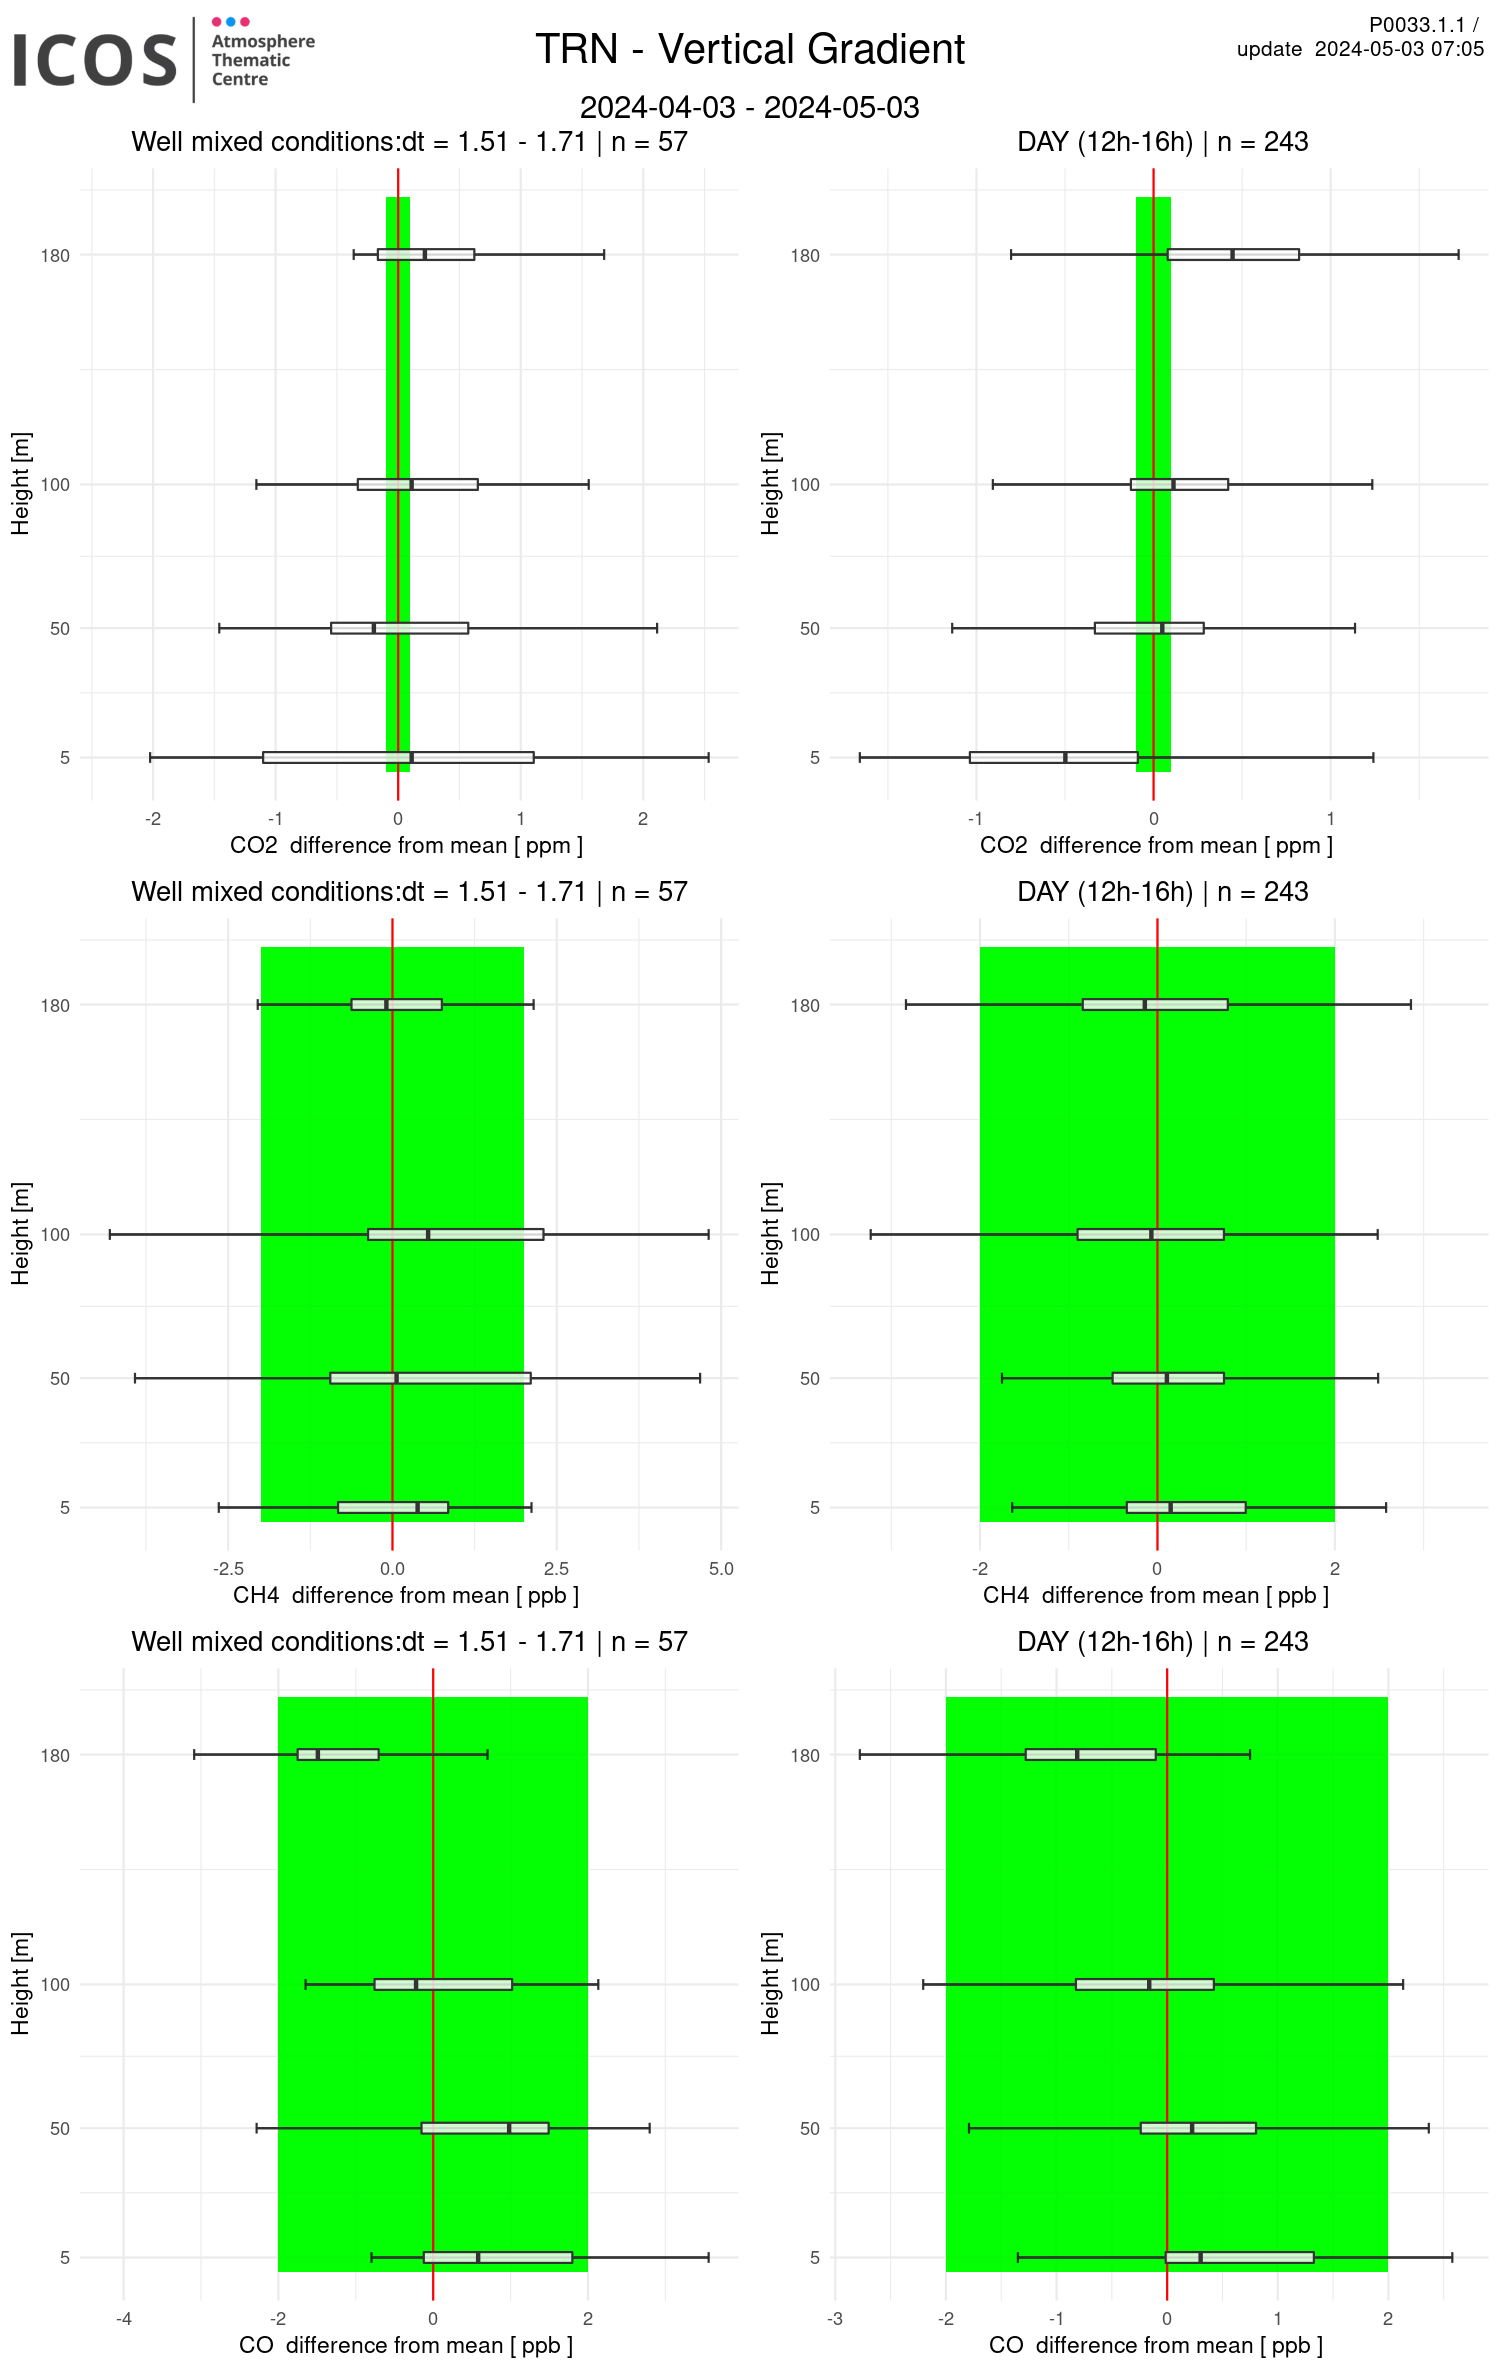
P0033.1.1 product shows the CO2 gradient in well-mixed air conditions for each site with continuous times series
Details
- Data used: Continuous air time series and meteo data (hourly mean).
- Timeframe: as described in header's subtitle (generally one rolling year).
- Species: as described in plot's title.
Background
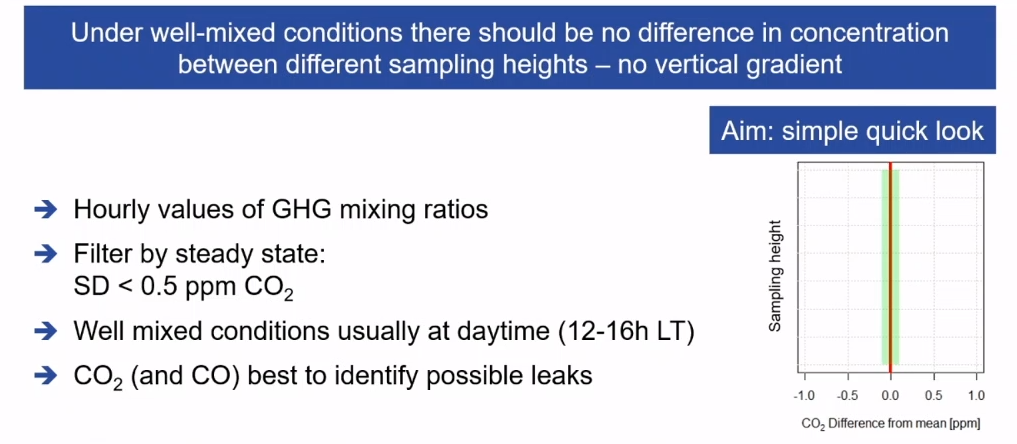
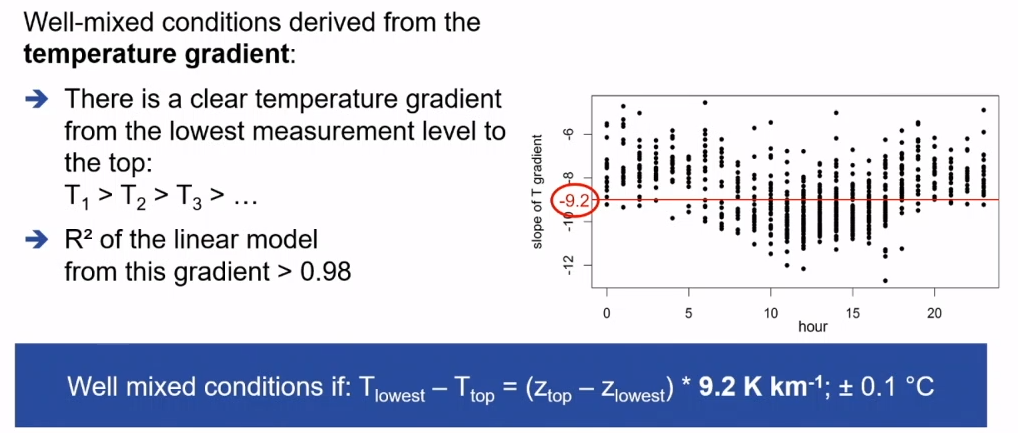
The vertical gradients can be used for data quality control by comparing the measurements of the different heights under well-mixed conditions. Under such well-mixed conditions there should be no marked differences between the concentrations at different heights and a leakage in one of the sampling lines could be seen. Vertical gradients contain valuable information for spatial representativeness and can be a useful tool for quality control at atmospheric tall tower stations [Lindauer et al. 2020].
 |
 |
Reference
[Lindauer et al. 2020] - Vertical gradients of greenhouse gases at 8 German atmospheric ICOS Stations, ICOS Science Conference 2020 - https://www.icos-cp.eu/sc2020/abstracts#68
Product for ICOS network
 |
 |
 |
 |
 |
 |
 |
 |
 |
 |
 |
 |
 |
 |
 |
 |
 |
 |